pH value
Lab 865
30
ba77145e02
12/2017
5.2.5 Calibration points
Calibration can be performed using one to five buffer solutions in any order
(single-point to five-point calibration). The meter determines the following
values and calculates the calibration line as follows:
5.2.6 Calibration data
Displaying the cali-
bration data
The calibration record of the last calibration is to be found under the menu item,
<F1>
/ [Menu]
Calibration
/
Calibration record
. To open it, press the
<CAL__>
key in the measured value display.
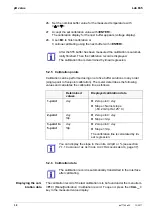
26. Set the nominal buffer value for the measured temperature with
<
><
>
.
27. Accept the set calibration value with
<ENTER>
.
The calibration display for the next buffer appears (voltage display).
28. Use
<M>
to finish calibration or
Continue calibrating using the next buffer with
<ENTER>
.
After the fifth buffer has been measured the calibration is automat-
ically finished. Then the calibration record is displayed.
The calibration line is determined by linear regression.
Determined
values
Displayed calibration data
1-point
Asy
Zero point =
Asy
Slope = Nernst slope
(-59.2 mV/pH at 25 °C)
2-point
Asy
Slp.
Zero point =
Asy
Slope =
Slp.
3-point to
5-point
Asy
Slp.
Zero point =
Asy
Slope =
Slp.
The calibration line is calculated by lin-
ear regression.
You can display the slope in the units, mV/pH or % (see section
7.1.1 C
The calibration record is automatically transmitted to the interface
after calibrating.


