


Pixie-4 Express User Manual
Version 4.21
May 18, 2016
6
1 Introduction
The Pixie-4 Express is designed, among other things, to acquire list mode data from
coincident events in multiple radiation detectors. The methods to set up and acquire such
coincident data, and basic functions to view results, are described in the Pixie-4 Express
User’s Manual. More advanced functions to display coincident events, including the
generation of 2D energy spectra, are provided as a set of add-on procedures to the Pixie
Viewer interface. These functions are described in this document.
1.1 Pixie-4 Express Coincident Energy Plotting Functions
Plotting of Ey vs Ex scatter plots (x,y = channel 0,1,2,3 of the same module)
Histogramming of data into Ey vs Ex 2D histograms
Definition of region of interest (ROI) in the histogram
Extraction of ROI sum and 1D projections
Export as ASCII text and other formats
TDC histograms (offline)
1.2 System Requirements
The advanced energy plotting functions require the Pixie Viewer software (version 4.21 or
higher) and Wavemetrics’ Igor Pro (version 6.22 or higher).
High resolution histograms require significant PC memory and processing power.
1.3 Software Overview
The advanced energy plotting functions are contained in an Igor procedure file (ipf). After
starting the Pixie Viewer as described in the User’s Manual, the procedure file must be
loaded to make use of the functions. See section 2 for details.
The functions operate on list mode data files acquired previously. They can (currently) not
be used for processing during acquisition, but are fully functional in offline mode.
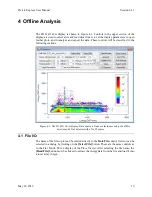
All controls are consolidated in two plots, the 2D
SPECTRUM
, shown in Figure 4-1 and the
T
IME
D
IFFERENCE
panel, shown in Figure 4-3.
1.4 Support
Please read through this manual before contacting us. Contact information is listed in the
first few pages of this manual.