


Pixie-4 Express User Manual
Version 4.21
May 18, 2016
10
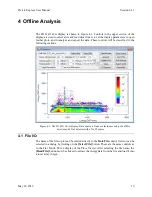
4 Offline Analysis
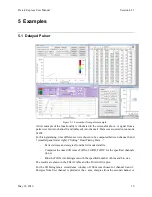
The 2D
SPECTRUM
display is shown in Figure 4-1. Controls in the upper section of the
display are used to select a file and read data from it, to set the display parameters, to open
further plots, and to analyze and export the data. These controls will be described in the
following sections.
Figure 4-1: The 2D
S
PECTRUM
display. Data shown is from a coincidence setup of a HPGe
detector and a NaI detector with a Na-22 source
4.1 File I/O
The name of the file to plot can be entered directly in the
Data File
control field, or can be
selected in a dialog by clicking on the
[Select File]
button. These are the same controls as
in the L
IST
M
ODE
T
RACE
display of the Pixie Viewer. After selecting the file name, the
[Read File]
button must be clicked to extract the energy data from the file and load it into
a local array in Igor.