13
6.1. Run
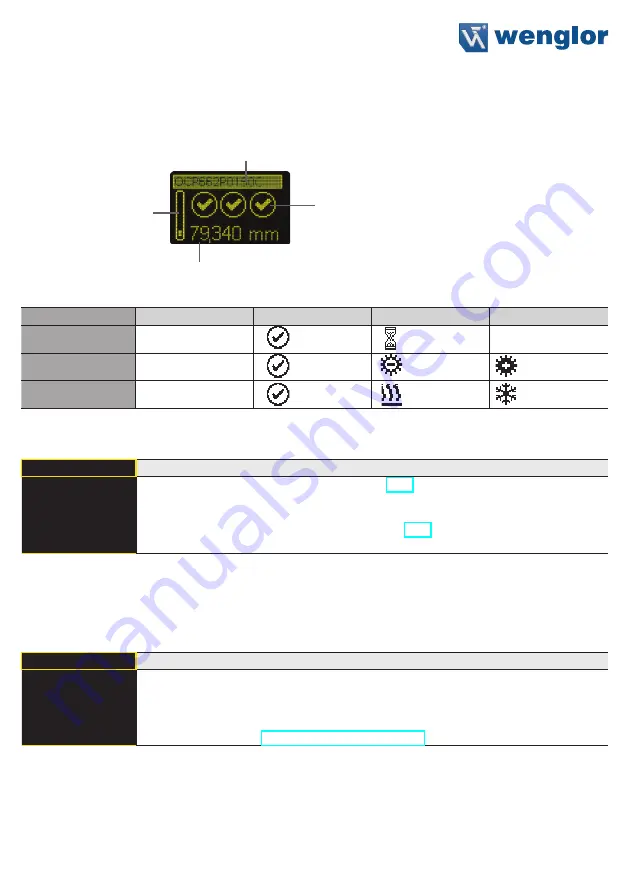
The Sensor switches into display mode.
EtherCAT device name
Current measured value in mm
Bar graph display of the current
measured value relative to the
measuring range
Status LEDs
Symbol descriptions of status LEDs:
Symbol
Significance
State 1
State 2
State 3
Symbol 1
Warm-up
ok
wait
–
Symbol 2
Signal Strength
ok
too low
(dirty)
too high
Symbol 3
Temperature
ok
too high
too low
6.2. Display
Display
Adjust the display device
Mode
Rotate
Intensity
3
Back
7
Run
Mode:
Select display mode (see chapter 6.2.1)
Rotate:
Rotate display by 180°. By pressing the “
” button the display is rotated
by 180°. The rotation is canceled by pressing this button again.
Intensity:
Set the display intensity (see chapter 6.2.2)
6.2.1. Display Mode
The measured value in mm and the order number always appear at the sensor’s display. Selection can be
made amongst the following additional displays using the “Display Mode” menu option:
Mode
Adjust the display device
Process
Text
Analysis
Network
Process:
Display of status LEDs for warm-up, signal strength and temperature.
Text:
Display of a free text that can be sent to the Sensor via the control.
Analysis:
Display of signal strength in percent and measuring rate in 1/s.
Network:
Display of the EtherCAT LEDs MS, CS and L/A. For the function of these
Summary of Contents for OCP P0150C Series
Page 23: ...23...


