14
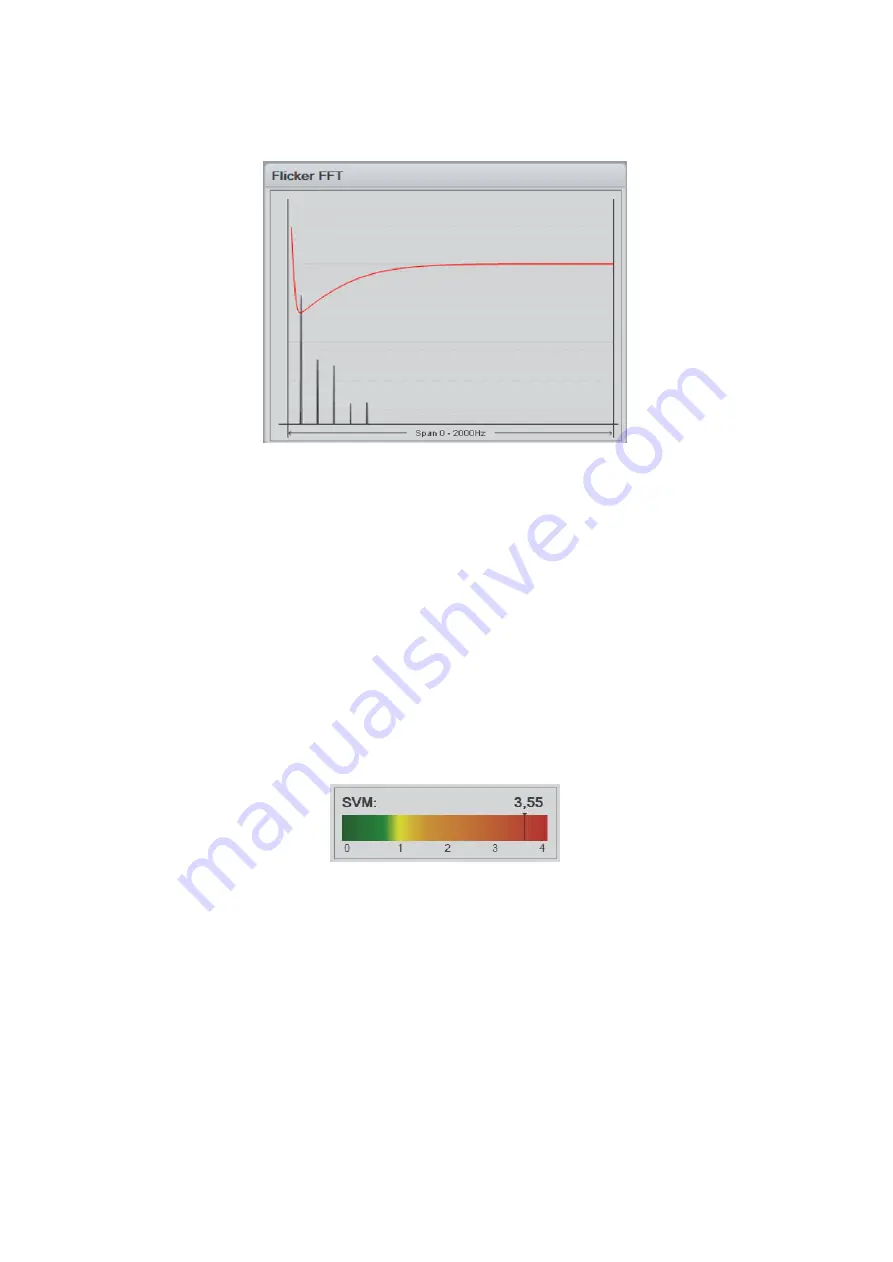
Flicker FFT
The Flicker FFT graph shows the different flickering frequencies represented in the light
produces by the AC supply combined with the used light source and driver technology.
SVM
Or ‘
Stroboscopic visibility measure
’ is based on several parameters like: Intensity, Flicker Index,
frequency etc.
If you for example have 100% flicker at 1000Hz flicker frequency the flicker index is very high
but at a 1000Hz the human eye will not observe the flicker, so ‘Percent Flicker’ and ‘Flicker
Index’ does not tell you the actual stroboscopic effect we humans perceive, t
herefore, instead
of
the ‘Flicker
Index
and ‘Percent Flicker’,
the Stroboscopic effect Visibility Measure (SVM) is
available that tells you the effect on the human eye.
The SVM threshold curve can be seen in the Flicker FFT graph above and what is below the red
SVM is not visible to the human eye. The lower the frequency the more visible it is to the
human eye.
The SVM value can be read as:
SVM < 1
,
Not Visible
SVM > 1
,
Visible
SVM = 1
,
Just Visible


