3
5. Mix the reactants, transfer ~2 mL of the reaction mixture to a cuvette and place
the cuvette in the spectrometer. Click
. You may click
to end
data collection early.
6. Click Curve Fit, , to calculate a function for your data.
Using a Spectrometer to Measure Emission Spectra
You may use your spectrometer to measure the emission spectrum of a light source
such as an LED or a gas discharge tube. To do so, you may want to purchase an
optical fiber assembly (order codes: VIS-NIR or UV-VIS).
Measure an Emission Spectrum
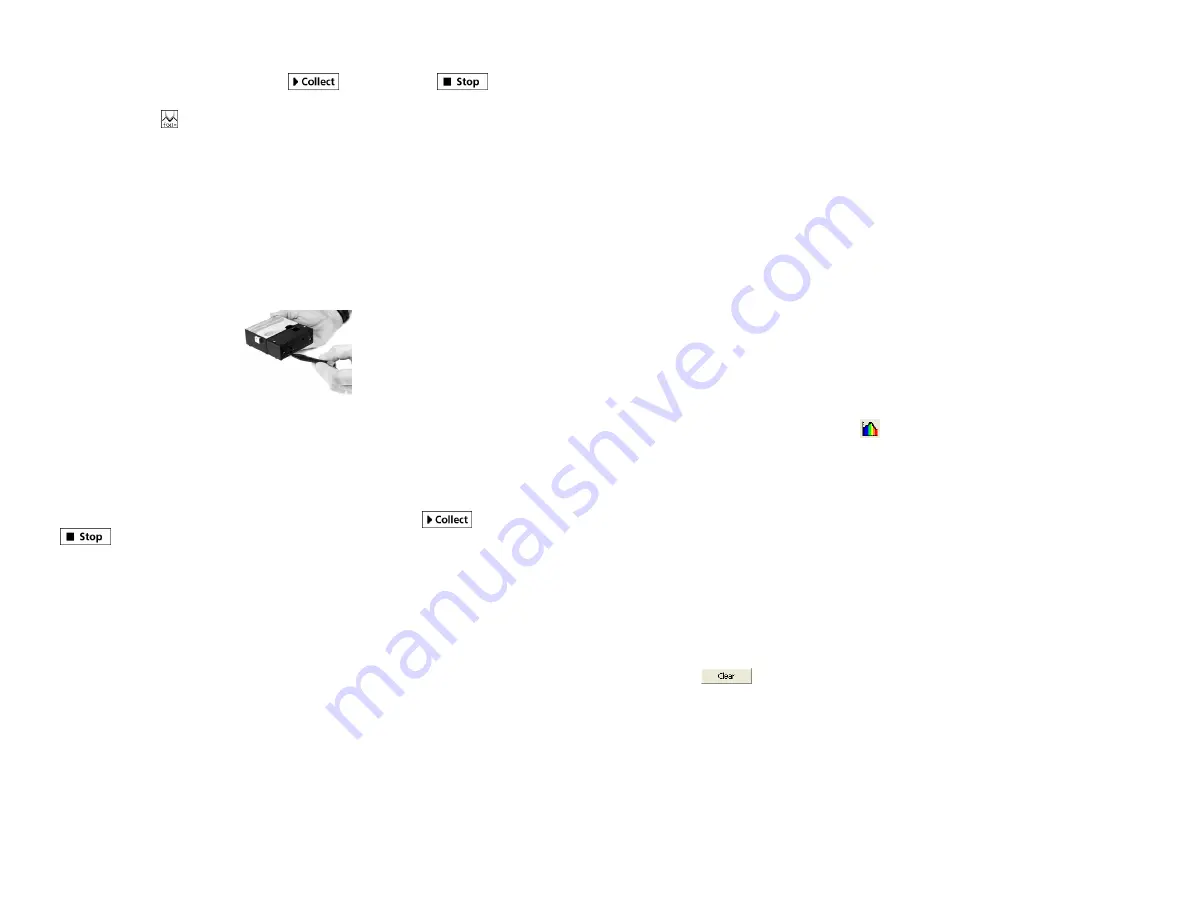
1. Use a small screwdriver to loosen the two screws that connect the cuvette holder
to the spectrometer (see Figure 1). Remove the cuvette holder and connect an
optical fiber assembly to the spectrometer.
Figure 1
2. Use a USB cable to connect the spectrometer to your computer.
3. Start Logger
Pro
3.
4. Choose Change Units
►
Spectrometer
►
Intensity from the Experiment menu.
Intensity is a relative measure.
5. Aim the tip of the optical fiber cable at a light source. Click
. Click
to end data collection. If the spectrum maxes out (flat and wide peaks),
increase the distance between the light source and the tip of the optical fiber cable
or reduce the sample time. To adjust the data collection parameters, choose Set
Up Sensors
►
Spectrometer from the Experiment menu. Set the Sample Time to
a suitable value and decrease the Samples to Average to 1.
Using the Stored Emissions Files in Logger
Pro
3
Logger
Pro
3 contains a folder of emissions graphs from selected discharge tubes,
including: argon, helium, hydrogen, mercury, oxygen, sodium, and xenon. You can
display and analyze these graphs without a spectrometer connected to your
computer. Follow the steps below to view one of these graphs.
1. Choose Open from the File menu.
2. Open the Sample Data folder.
3. Inside the Sample Data folder, open the Physics folder.
4. Inside the Physics folder, open the Gas Discharge Spectra. Open the desired file.
You can use the mercury emissions graph to test fluorescent lighting for the presence
of mercury.
4
Changing the Settings in Logger
Pro
3
Spectrometer Dialog Box
The Spectrometer dialog box lists all of the settings for the device. To display this
box choose Set Up Sensors
►
Show All Interfaces from the Experiment menu.
For most experiments, the default settings work well.
There are four parameters listed in the dialog box.
Sample Time: think shutter speed of a camera. Logger
Pro
3 automatically selects
the proper sample time during calibration.
Note:
For emission studies, you may
need to change the sample time manually.
Wavelength Smoothing: the number of adjacent readings on either side of a given
value that is used to calculate an average value.
Samples to Average: the number of readings taken at a given wavelength to
calculate an average reading.
Wavelength Range: the range is determined by the type of spectrometer in use.
By clicking on the picture of the spectrometer in this dialog box, you will gain
access to four options: calibrate, configure data collection, go to support web page,
and units of measure. Click on an item to select it.
Configure Spectrometer Data Collection Dialog Box
To display this box, click on its icon, , located on the right hand side of the
toolbar.
There are three regions in this box and four buttons at the bottom.
Graph: The graph displays a full spectrum analysis of the sample in the cuvette
holder. By default, the wavelength of greatest absorbance (peak) will be marked
with a box. You may select other wavelengths by clicking on the plot at the
desired wavelength. A checkbox beneath the graph allows you select a portion of
the graph and analyze it as a single range of wavelengths.
Set Collection Mode: Three options for data collection are offered. A full
spectrum analysis (Abs
vs
. Wavelength) is the default.
Full Spectrum/Select Wavelength: This column lists all the available
wavelengths. It becomes active when you select Abs
vs
. Concentration or Abs
vs.
Time. Check the box for each wavelength you wish to use in an experiment.
When you select a wavelength from the list, a box appears on the graph.
Use the
button to remove all of the wavelengths selected on the graph.


