


List of Figures
Figure 2-1 Example 3D Sensing System
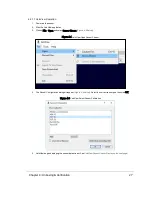
Figure 4-1 Sensor Network Settings
Figure 4-2 Interface Box (power and data connections)
Figure 4-3 Sample Web Interface Main Configuration Screen
Figure 4-4 VeloView Open Sensor Stream
Figure 4-5 VeloView Select Sensor Calibration
Figure 4-6 VeloView Sensor Stream Display
Figure 6-2 Dual Return with Last and Strongest Returns
Figure 6-3 Dual Return with Second Strongest Return
Figure 6-4 Dual Return with Far Retro-Reflector
Figure 6-5 Forestry Application Multiple Returns
Figure 6-6 Phase Locking Example
Figure 7-1 Interface Box (sensor power and data connections)
Figure 7-2 Synchronizing PPS with NMEA GPRMC Message
Figure 7-3 PPS Signal Closely Followed by NMEA GPRMC Message
Figure 7-4 PPS Signal Followed 600 ms later by NMEA GPRMC Message
Figure 7-5 RS-232 Example Transmission
Figure 7-6 Garmin GPRMC Message
Figure 7-7 DB9 Pin-outs (DTE) and USB-to-Serial Adapter
Figure 7-8 Signal Directly from UART (incorrect polarity)
Figure 7-9 Inverted Signal from UART (correct polarity)
Figure 8-1 Firing Sequence Timing
Figure 8-2 Point Density Example
Figure 9-1 VLP-16 Sensor Coordinate System
Figure 9-2 VLP-16 Single Return Mode Data Structure
Figure 9-3 VLP-16 Dual Return Mode Data Structure
Figure 9-4 Single Return Mode Packet Data Trace (packet start)
Figure 9-5 Single Return Mode Packet Data Trace (ending)
Figure 9-6 Wireshark Position Packet Trace
Figure 9-7 Firing Sequence Timing
Figure 9-8 Example Data Point Timing Calculation
12
VLP-16 User Manual