E-22
3D Mapping Function
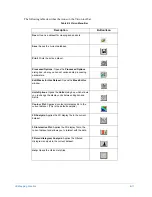
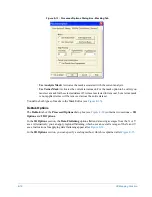
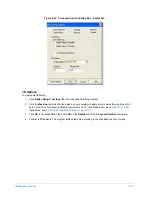
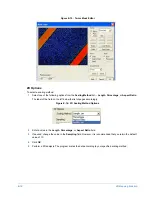
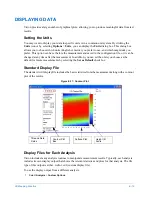
Figure E-19: Icons for Main Analysis Plots.
Contour Plot
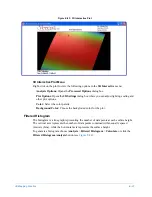
A contour plot provides a visual, pixel-for-pixel representation of your dataset and applicable dataset
statistics. Data heights are color-coded for easy interpretation. To display a contour plot of the current
dataset, select
Analysis
>
Contour
,
Analysis
>
Custom Options
>
Contour Plot
>
OK
, or click the
Contour Plot
). This option is available when a dataset is open.
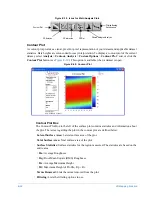
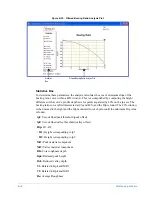
Figure E-20: Contour Plot
Contour Plot Box
The Contour Plot Box to the left of the surface plot contains statistics and information about
the plot. The terms regarding the plot in the contour plot are defined below:
•
Lateral Surface Area:
Lateral surface area of the plot.
•
Total Surface Area:
Total surface area of the plot.
•
Surface Statistics:
Surface statistics for the region measured. The statistics are based on the
entire area.
•
Ra:
Average Roughness
•
Rq:
Root Mean Square (RMS) Roughness
•
Rz:
Average Maximum Height
•
Rt:
Maximum Height of Profile, Rp + Rv
•
Terms Removed:
Lists the terms removed from the plot.
•
Filtering:
Lists the filtering options in use.
Filtered Bearing
Ratio Analysis
Filtered Histogram Analysis
2D Analysis
Contour Plot
3D interactive
3D Plot
Summary of Contents for Dektak 150
Page 1: ......
Page 7: ......
Page 17: ......
Page 81: ......
Page 105: ......
Page 149: ......
Page 191: ......
Page 251: ......
Page 257: ...A 6 Facilities Specifications Figure A 6 Dektak 150 without Enclosure Side View ...
Page 258: ...Facilities Specifications A 7 Figure A 7 Dektak 150 Dimensions without Enclosure Top View ...
Page 259: ...A 8 Facilities Specifications Figure A 8 Dektak 150 without Enclosure Center of Mass ...
Page 273: ......
Page 283: ......
Page 321: ......
Page 331: ......
Page 333: ......
Page 336: ......
Page 337: ......
Page 349: ......

