background image


UTD2000 Series User Manual 

34 


■ 

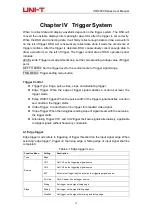
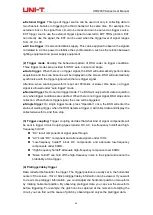
External trigger

: This type of trigger source can be used not only in collecting data in 

two channels but also in triggering the third channel at the same time. For example, the 

external clock or the signal from circuit to be measured can be served as trigger source. 

EXT trigger source use the external trigger signal connected to EXT TRIG junction. EXT 

can directly use the signal, the EXT can be used when the trigger level of signal ranges 

from -3V to +3V. 

■ 

AC line trigger

: It is also called Mains supply. This can be applied to observe the signals 

correlated to AC line power to stabilize the synchronization, such as the relation between 

lighting equipment and power supply equipment.   


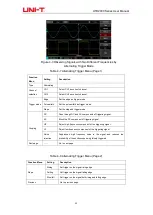
(2)  Trigger  mode

:  Deciding  the  behavioral  pattern  of  DSO  under  no  trigger  conditions. 

Three trigger modes are provided for DSO: auto, normal and single. 

■ 

Auto trigger

: When there is no trigger signal, the DSO will automatically perform data 

acquisition and the scan base line will be displayed on the screen. DSO will automatically 

synchronize with the trigger signal when there is trigger signal. 

Attention:  when  scanning  waveform  is  set  as  100ms/div  or  slower  time base,  no  trigger 
signal is allowed under “auto trigger” mode.   
■ 

Normal trigger

: Set to normal trigger mode. The DSO will only perform data acquisition 

only when trigger conditions are satisfied. When there is no trigger signal, DSO stops data 

collection. When there is trigger signal, the scan will be triggered. 

■ 

Single


trigger

On single trigger mode, press “Operation” once, the DSO will enter the 

status of waiting trigger, when the DSO detects a trigger, it will collect data and display the 

collected waveform, and then stop. 


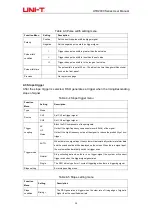
(3) Trigger coupling: 

Trigger coupling decides that what kind of signal components will 

be sent to trigger circuit. Coupling types include: DC, AC, low-frequency holdoff and high-

frequency holdoff. 


“DC” let all components of signal pass through. 


“AC” block “DC” component and attenuate signals under 10Hz. 


“Low-frequnecy  holdoff”  block  DC  components  and  attenuate  low-frequency 
components under 80kHz. 


“High-frequency holdoff” attenuate high-frequency component over 80kHz. 


“Noise holdoff” can hold off the high-frequency noise in the signal and reduce the 
probability of mis-trigger. 


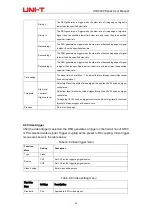
(4) Pretrigger/delay trigger 

Data collected before/after the trigger. The trigger position is usually set in the horizontal 

center of the screen, 7div or 8div pretrigger/delay information can be viewed. If you want 

to view more pretrigger information, you could adjust the horizontal position of waveform 

by rotating horizontal position. By observing pretrigger data, you can view the waveform 

before triggering. For example, the glitch can be captured at the moment of starting the 

circuit, you can find out the cause of glitch by observing and anlyze the pretrigger data. 

Summary of Contents for UTD2052CL+

Page 1: ...UTD2000 Series Digital Oscilloscope User Manual www uni trend com cn...

Page 2: ...China Co Ltd All rights reserved Trademark Information UNI T is the registered trademark of Uni Trend Technology China Co Ltd Document Version UTD2000 20210816 V3 00 Statement UNI T products are prote...

Page 3: ...delivered to an address within the country where the maintenance centre operates Uni T shall pay the cost of returning the product to the destination all freight custom duty tax and other costs will b...

Page 4: ...AN Plug AC 125V 10A UL 498 Cord 3X18AWG 300V 105 C Connector AC 125V 10A Correct Plug Don t plug when the probe or test wire is connected to the voltage source Ground the product This product is groun...

Page 5: ...ltage Please do not operate the product in humid conditions Please do not operate in inflammable and explosive environment Please keep the product surface clean and dry Radio frequency magnetic field...

Page 6: ...l damage to the operator Note This operation may cause damage to the product and devices connected to the product The following symbols may appear on the product Symbol Description Direct current Alte...

Page 7: ...the following 9 models Series Model Band Width Sampling Rate UTD2000 UTD2052CL 50MHz 500MS s UTD2072CL 70MHz 500MS s UTD2102CL 100MHz 500MS s UTD2102CL PRO 100MHz 500MS s UTD2152CL 150MHz 500MS s UTD2...

Page 8: ...ay 800 480 resolution Support plug and play USB storage equipment or be capable of communicating with computer via USB storage equipment Automatic waveform and state settings Waveform saving and repla...

Page 9: ...ng coupling channel 17 2 2 Setting channel bandwidth Limited 18 2 3 Setting probe Rate 19 2 4 Vertical Volts Div adjustment setting 19 2 5 Settings of waveform inverting 20 2 6 Mathematical operation...

Page 10: ...Upgrade program 51 Chapter XII Applicaion example 52 Example 1 Measuring simple signals 52 Example 2 Observing the delay caused by a sine wave signal passes through the circuit 52 Example 3 Acquiring...

Page 11: ...ase contact the UNI T product distributors or local UNI T offices If the instrument is damaged due to transportation please pay attention to keeping the package notify transportation department and UN...

Page 12: ...ment of probe compensation follow the following steps Set the probe menu attenuation coefficient as 10 place the switch on the probe at 10 and connect DSO probe with CH1 If hook shape head of probe is...

Page 13: ...t contact the metal part of the probe when connecting high pressure power supply 1 3 Front and Rear Panel Figure 1 3 Front Panel Figure 1 4 Rear Panel Display area USB host interface Control Menu butt...

Page 14: ...matic setting application the frequency of the measured signal is required to be 20Hz Apply automatic setting 1 Connect measured signal to signal input channel 2 Press AUTO key DSO will automatically...

Page 15: ...l be filtered which helps to display AC component of signal with higher sensitivity 2 Vertical SCALE Change vertical setting and observe the change of status information User can confirm any change of...

Page 16: ...t trigger holdoff time on this menu 1 7 Introduction to the Trigger System As shown in Figure 1 8 there is one knob and four keys in trigger menu control area Practices below will gradually guide you...

Page 17: ...Fine Volts Div is within the range of coarse Volts Div setting set the vertical scale of current channel based on 1 step of current Volts Div scale Probe 0 01 0 02 100 1000 Based on probe attenuation...

Page 18: ...he instrument both DC and AC components of the input signal are blocked And waveform display is shown in figure below Figure 2 3 Simultaneous Blocking of Signal DC and AC Components 2 2 Setting channe...

Page 19: ...form Display When Setting Bandwidth throttling as ON 2 3 Setting probe Rate In order to cooperate with attenuation coefficient setting of probe it is required to set the probe attenuation coefficient...

Page 20: ...ent vertical gear position range Vertical deflection factor can be consecutively adjusted within all vertical gears Figure 2 7 Coarse and Fine Adjustment of Vertical Deflection Factors 2 5 Settings of...

Page 21: ...urce2 as CH2 Operator Source1 Source2 Source1 Source2 Source1 Source2 Source1 Source2 Source2 CH1 You can select signal source1 as CH1 CH2 You can select signal source2 as CH2 2 8 FFT spectral analysi...

Page 22: ...waveform by a window function the value at forced starting and ending positions is 0 See the table below for window function application Table 2 5 FFT window function FFT Window Features The most sui...

Page 23: ...rent upper frequency limit can the signal pass through Band pass Only when the signal frequency is higher than current lower frequency limit and lower than current upper frequency limit can the sigal...

Page 24: ...ime base set as main time base the main time base will change when adjusting horizontal time base Extension time base set as extension time base the extension time base will change when adjusting hori...

Page 25: ...m that has been extended horizontally from selected original waveform area What users should pay attention is that the extension time base enhances the resolution compared with main time base as shown...

Page 26: ...figure out the frequency and phase relation between two signals according to Lissajous figures below Figure 3 4 Common Lissajous Figures Only when CH1 and CH2 are used simultaneously can this method b...

Page 27: ...ignal satisfies a certain set level the trigger starts Pulse Width Trigger When the pulse width of the trigger signal satisfies a certain set condition the trigger starts Video Trigger Conduct field o...

Page 28: ...trigger menu Function Menu Setting Description Type Pluse Source CH1 Set CH1 as the triggering signal source CH2 Set CH2 as the triggering signal source EXT Set external trigger input channel as the t...

Page 29: ...as trigger signal CH2 Set CH2 as trigger signal Trigger coupling AC HF Noise Block the DC components of insput signals Hold off the high frequency components over 80kHz of the signal Hold off the hig...

Page 30: ...t 20ns 10s adjust the time through the multifunctional knob on front panel Threshold High level Low level High low level Adjust high level threshold of slope trigger through the LEVEL knob on trigger...

Page 31: ...1 is an example screen display when PAL video trigger model is selected as standard and the synchronization mode is selected as line synchronization Figure 4 2 is an example screen display when the sy...

Page 32: ...the slope as trigger mode Coupling DC Pass through DC and AC components of triggering signal AC Block the DC component of triggering signal HF Reject high frequency component of the triggering signal...

Page 33: ...e Hold off time To adjust the trigger hold off time by multi purpose knob Take pulse series as example trigger the first pulse on the pulse series then the holdoff time can be set as pulse string widt...

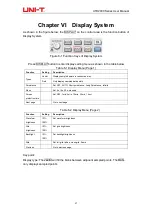
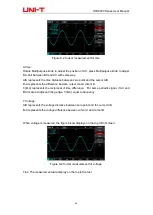
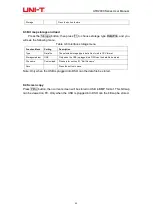
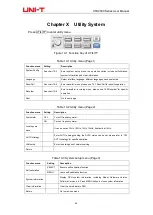
Page 34: ...uisition only when trigger conditions are satisfied When there is no trigger signal DSO stops data collection When there is trigger signal the scan will be triggered Single trigger On single trigger m...

Page 35: ...splay waveform High resolution The DSO averages the proximal point of acquired waveform to reduce random noise of input signal and display a smoother wave on the screen Average The DSO acquires some w...

Page 36: ...the real time sampling rate of the system This is used to observe any waveform within the sampling rate of the system Equivalent sampling mode Data sampling at higher than maximum sampling rate of th...

Page 37: ...display sampled data points Persistance Set OFF AUTO Short persistence Long Persistence infinite Menu Set 5s 10s 20s manualy Screen protection time Set OFF 1min 5min 10min 30min 1 hour Next page Go to...

Page 38: ...ameter Pop up a selection interface with custom parameters press the multifunctional knob to display parameters Press custom parameter key or MENU key to close the selection interface extremum and ave...

Page 39: ...est level to waveform lowest level Amplitude Amp The voltage value from waveform top to waveform bottom Mean value Mean The average amplitude value of waveform Cycle mean CycMean The average amplitude...

Page 40: ...the first falling edge of source 1 to the first falling edge of source 2 FRLF The time between the first rising edge of source 1 to the last falling edge of source 2 FRLR The time between the first r...

Page 41: ...acking is selected move cursor 1 and cursor 2 at the same time T unit Second hertz Set the unit of time measurement Source CH1 CH2 Math Set measurement source 8 2 Cursor measurement display On CURSOR...

Page 42: ...e beween cursor A and cursor B 1 B A represents the reciprocal of time difference For same periodic signal if AX and BX locate at adjacent rising edge 1 B A equal to frequency Y Voltage A B represents...

Page 43: ...Select storage location DSO can store 20 groups USB can sotre 200 groups Delete File name Delete Delete the stored files File name The menu will change to file name when the storage medium is USB Sav...

Page 44: ...Menu Setting Description Data source CH1 CH2 Select storage channel Storage medium DSO USB Select the set storage location File name Customized Please refer section 9 1 Edit file name Store Press the...

Page 45: ...elected storage type is data file stored in CSV format Storage medium USB Only when the USB is plugged into DSO can the data file be stored File name Customized Please refer section 9 1 Edit file name...

Page 46: ...ext Go to next page Table 10 2 Utility menu Page 2 Function menu Setting Description Cymometer OFF Turn off frequency meter ON Turn on frequency meter Local square wave It can be set as 10Hz 100Hz 1kH...

Page 47: ...Set the source Enter Pass Fail menu and then press F3 to set source 4 Display information The screen displays test result 5 Next page 6 Stop setting enter stop setting menu Table 10 4 Stop Setting Fun...

Page 48: ...ding 1 Replay button 2 Press this button to replay the replayed frame number displays on the screen rotate the multifunctional knob to stop replaying if keep rotating the knob a particular frame of wa...

Page 49: ...up Release Lock Release The channel setting is set as default after AUTO operation Lock The channel setting is unchanged after AUTO operation Sampling setup Release Lock Release The acquiring mode aut...

Page 50: ...ment according to signal frequency Trigger coupling DC Trigger holdoff The minimum value Trigger level Set to 50 Trigger mode AUTO Trigger source Set to CH1 If there is no signal for CH1 and a signal...

Page 51: ...will display whether or not update press F3 to update If two or more than two program files are stored in USB the interface of selecting files will appear press F1 to select a program file to be updat...

Page 52: ...To measure signal frequency and peak to peak value follow the steps below Press MEASURE to display auto measurement menu Press F4 to enter custom parameter selection window Move the slection box thro...

Page 53: ...the selection box through multifunctional knob to rising time press multifunctional knob to complete the selection of rising delay parameter measurement Press F4 or MENU button to close custom parame...

Page 54: ...ired set the trigger level to just higher than the normal signal level Press RUN STOP and begin waiting When a glitch occurs the machine will automatically trigger and record the waveform immediately...

Page 55: ...being measured is stacked with random noise and the waveform is too coarse as a result you can use the average sampling mode to eliminate random noise display and reduce the size of waveform for easy...

Page 56: ...ontrol knob to set cursor 1 at one step voltage of the step signal 4 Press SELECT to select the cursor then turn the multifunction control knob again to set cursor 2 at another step voltage of the ste...

Page 57: ...elow to find the cause Check if the probe is connected to the signal test point correctly Check if the signal connection line is connected to the input point of analog channel Check if the input point...

Page 58: ...ect other acquiring modes i e normal sampling Check if the persistence in DISPLAY button menu is set relatively long or infinite 5 The waveform is like stair step shape Stair step waveform is normal T...

Page 59: ...052 CL UTD2072 CL UTD2102CL PRO UTD2102CL UTD2152 CL UTD2102 CEX UTD2152 CEX UTD2202 CEX UTD2202 PRO Real time 500MS s 500MS s 500MS s 500MS s 1GS s 1GS s 1GS s Equivalence 50GS s 50GS s 50GS s 50GS s...

Page 60: ...div 20 V div at 1 2 5 increment Position range 8div Selectable bandwidth limitation Typical 20MHz Low frequency response AC Coupling 3dB 5 Hz above BNC DC gain accuracy sampling or average sampling m...

Page 61: ...adjustable Hold off range 80ns 1 5s Set the level to 50 Typical Operate under the condition of input signal frequency of 50Hz Trigger mode AUTO normal single High frequency holdoff Hold off signals ov...

Page 62: ...FFF FRLF FRLR FFLR FFLF Measurement quantity Display 5 types of measurement at the same time Measurement scope Screen or cursor Measurement statistics Average value maximum value minimum value and sta...

Page 63: ...load 1M Frequency Typical 10Hz 100Hz 1kHz Default 10kHz Power Source Power voltage 100V 240V Fluctuations 10 50 60Hz Power consumption 100VA max Fuse F 1 6A 250V Environment Specifications Intended u...

Page 64: ...nstrument or probe with spray liquid or solvent so as to avoid damaging the instrument or probe 2 Clearing Check the instrument and probe frequently Clean the surface of the instrument according to th...

Page 65: ...nd except the guarantee given herein or in other applicable warranty UNI T makes no other express or implied guarantee including but not limited to any implied guarantee on the product s tradability a...

Reviews: