10.3.4 Experimental Approach
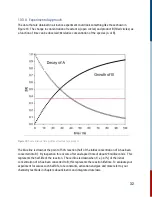
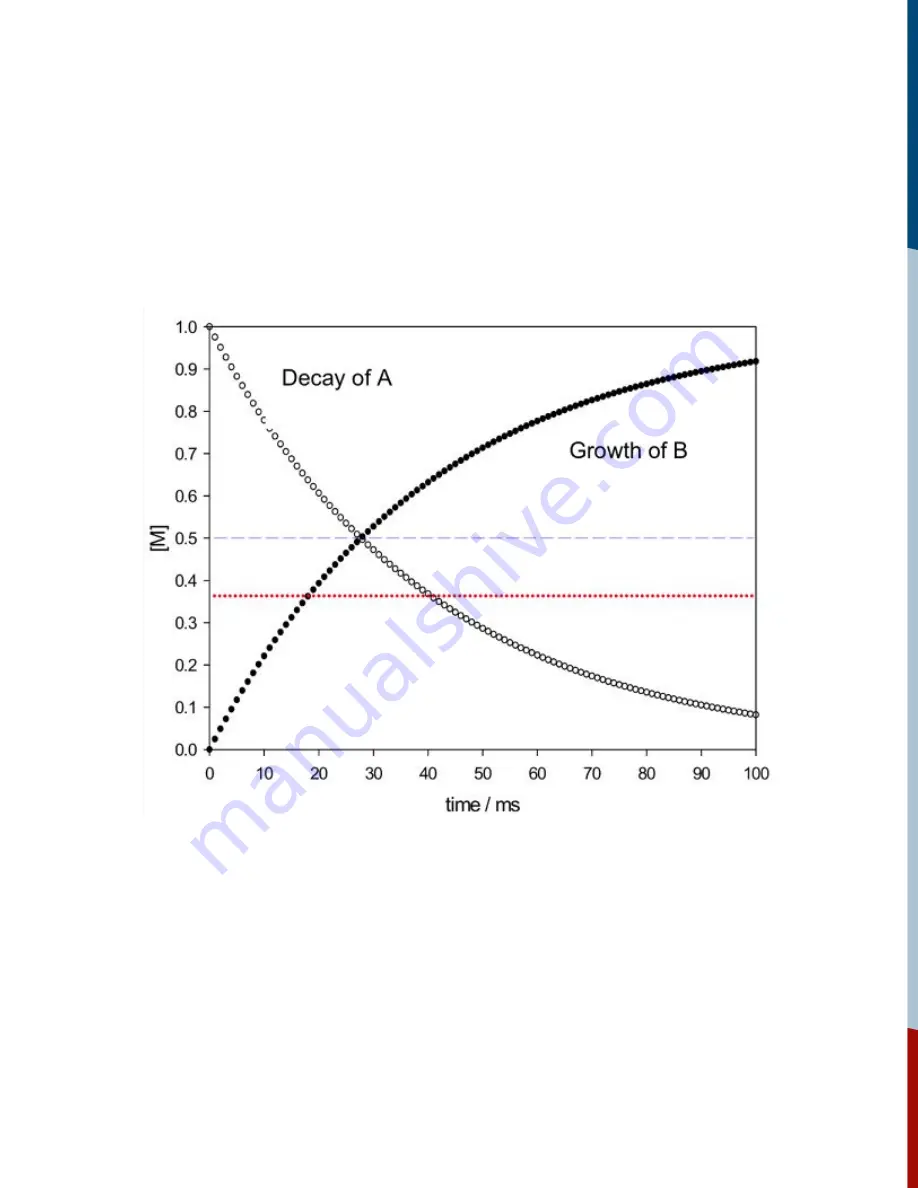
The data that are obtained in a kinetics experiment could look something like those shown in
Figure 18. The change in concentration of reactant A (open circles) and product B (filled circles) as
a function of time can be observed; M relative concentration of the species (A or B).
Figure 18:
Concentration time profiles of reactant and product.
The blue line is drawn at the point of 50% reaction (half of the initial concentration of A has been
converted into B). By inspection this occurs after an elapsed time of about 28 milliseconds. This
represents the half-life of the reaction. The red line is drawn when 1/e (~37%) of the initial
concentration of A has been converted to B; this represents the reaction lifetime. To evaluate your
experiment for values such half-life, rate constants, activation energies and more refer to your
chemistry textbook in chapters about kinetics and integrated rate laws.
32

