'
*
*
*
*
*
*
*
*
*
*
*
*
*
*
*
*
*
12
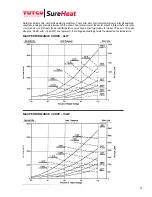
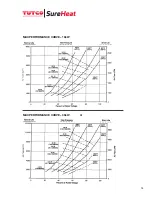
MAX PERFORMANCE CURVE – 6kW
MAX PERFORMANCE CURVE – 10kW
Solid lines indicate safe, normal-life operating conditions. The shorter dash lines indicate marginal, shorter-life operating
conditions leading to premature burnout. With a known flow (or pressure) at the heater entrance, follow the flow (or pres-
sure) line across until it meets the desired temperature curve. Drop a line straight down to intersect the x-axis. This point,
along the “Heater volts – true RMS” axis, represents the voltage required to generate the desired exit air temperature.

