25
Diagnostics
The Diagnostics function of the remote gateway allows for easy system troubleshooting. Within this function, the user
can monitor the gateway’s internal voltages as well as check the firmware version.
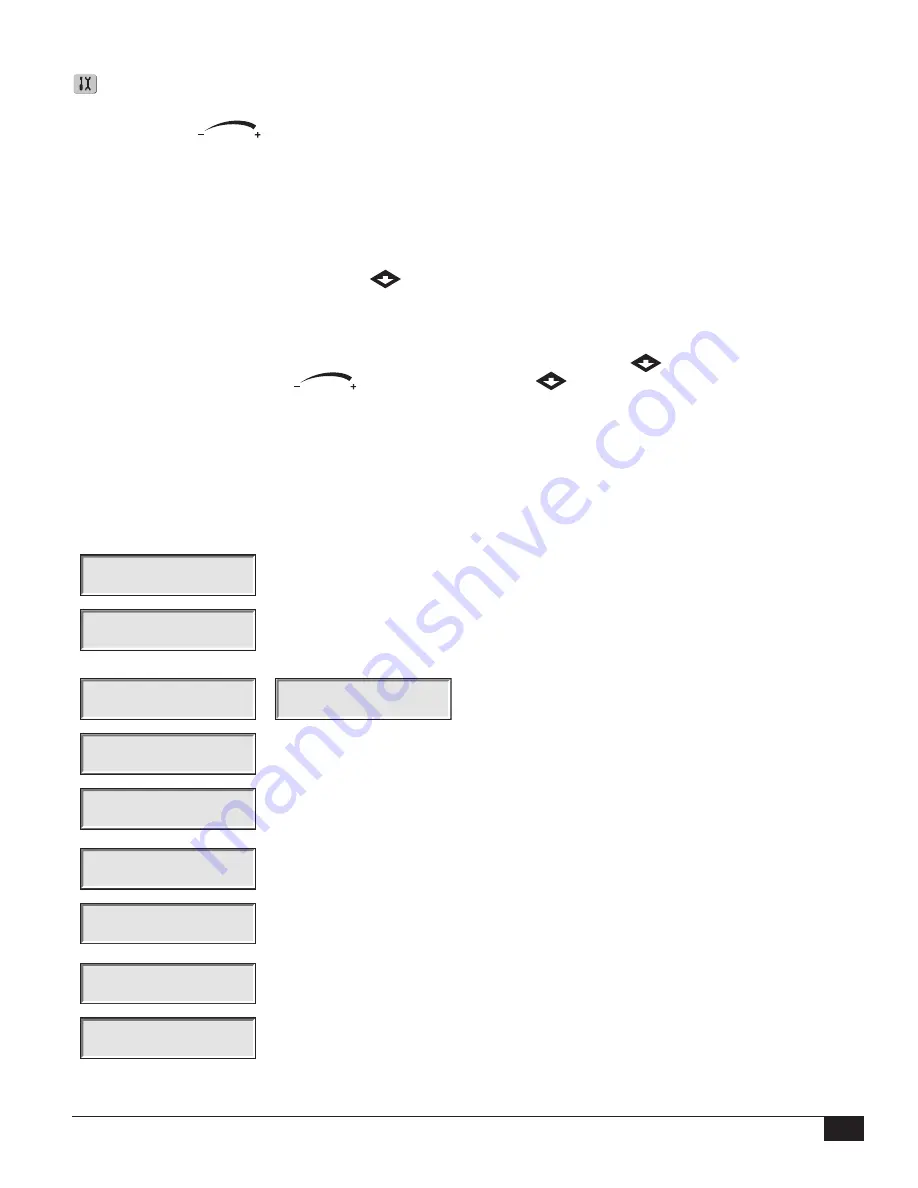
Use the Input Dial
to navigate through the menus while in the
Menu:
field.
Menu: Link Monitor
This menu item allows you to monitor communication network traffic.
Menu: System Monitor
This menu item allows you to monitor all the gateways in the system.
Menu: Revision
This menu item will display the gateway firmware version and creation date.
Menu: Power-Up Detect
This menu item will display the number of detected stations, number of detected sensors. It
will also display the date and time of the last power-down (PD) and last power-up (PU). Press
the Down arrow
to scroll down the informations.
Menu: VA Monitor
This menu item allows you to monitor the gateway’s amperage, voltages and temperature in
real-time. This allows you to troubleshoot the gateway’s internal circuit voltages.
Menu: Event Codes
This menu item will display the gateway’s Event Code log. You can clear the log from this
option. Navigate to the Clear field using the Down arrow
, select Yes using the Input
Dial
and press the Down arrow
to activate.
Menu: Link Settings
Use this menu item to view the gateway’s communication settings. Parameters can not be
edited here.
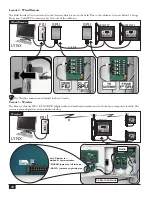
Motherboard Diagnostic Display
The Gateway motherboard features a 2-line, 16 character LCD display for quickly viewing for system diagnostic
information (see
Figure 6
,
page 9
). Use the left button below the LCD to scroll through the display lines and if needed, use
the right button the scroll through the available options.
Rev 2.02
03/28/2011
After power up, the screen will display board’s firmware version.
D1 A=1.500
D2 = OFF
After the initial Revision screen, the display will show the real time current for both
daughter boards.
D1L1=0.123 A
D1L2=0.121 A
D2L1=0.224 A
D2L2=0.223 A
The display will also show the load currents by individual
wires of a two-wire communication line.
Rain sw =open
Pump pres=closed
The display will show the Rain and Pump Pressure sensor state and will be updated in real
time.
D1 DEC 32396
10 min Send...
The display will show the information contained in the message during transmission
execution. The information will only be displayed while the transmission is being executed.
The display will refresh if a different command is transmitted.
Display Contrast
Psh Opt to Adj
Scroll to this menu to adjust the display contrast. Press the right button below the LCD to
adjust.
No Alarms
Use the Alarms display to view fault information such as daughter board thermal alarms,
shorts, high current and wire load imbalances. You can clear the alarms by pressing and
holding the scroll (left) button for four seconds.
00:00:06:23:05
This is the time counter in Month:Days:Hours:Minutes:Seconds which starts upon power
up.
Flow=0.00 Hz
The display will show the real time pulse frequency of the flow sensor input.


