CHAPTER 6. GRAPHING EQUATIONS/FUNCTIONS
6.6
F-Menus While Graphing
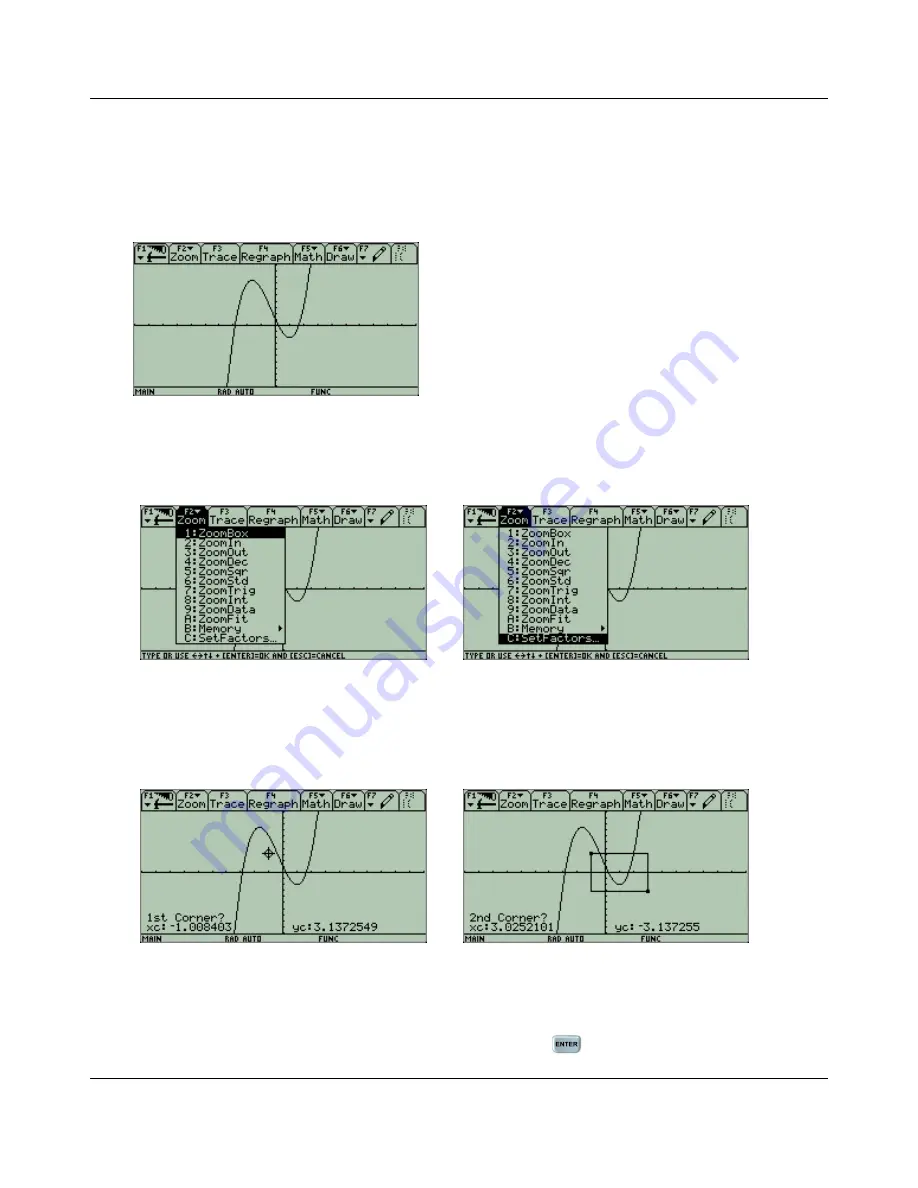
Some, but not all, of the available F-Menu commands in the
GRAPH
screen will be explained.
Graph
y
1 =
x
3
+
x
2
−
5
x
+ 1
in the standard viewing window.
All explanations will be done with this function as the example and viewed on the standard view-
ing window.
6.6.1
F2: Zoom
This is exactly the same
Zoom
menu that you have when you are in the
WINDOW
screen. After
each option is explained, I will assume that you regraph the function on the standard viewing
window.
1: ZoomBox
ZoomBox
allows you create a small box on your graph and then enlargers that box to fill the entire
window.
You need to specify the location of the first corner of the box is by moving the cursor with the
arrow keys to the location of the first corner and then press
. Then you need to specify the
27


