


Optimizing Evaluation Results
12
SBAU284 – January 2017
Copyright © 2017, Texas Instruments Incorporated
ADS58J64 EVM
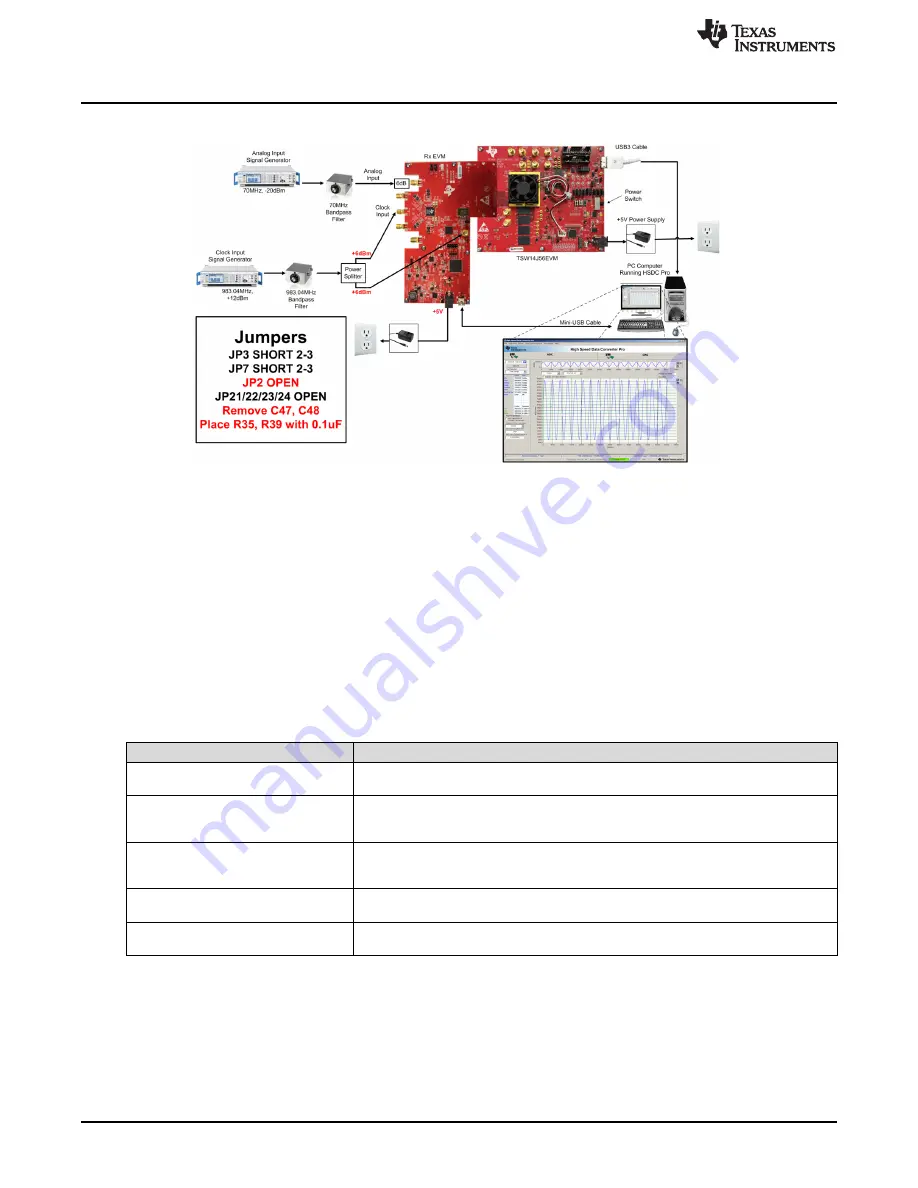
shows the test setup using an external device clock source.
Figure 6. Test Setup Using an External Device Clock Source
3.4
Using a Coherent Input Source Frequency
A rectangular window function can be applied to the captured data when the sample rate and the input
frequency are set precisely to capture an integer number of cycles of the input frequency (sometimes
called coherent frequency). Coherent input and sampling frequencies may yield better SNR results. The
clock and analog inputs must be frequency locked (such as through 10-MHz references) to achieve
coherency.
3.5
HSDC Pro Settings
lists the HSDC Pro options which can help improve the performance measurements.
Table 5. HSDC Pro Options for Optimal Analysis Results
HSDC Pro Feature
Description
Analysis window (samples)
Selects the number of samples to include in the selected test analysis. Collect more data
to improve frequency resolution of FFT analysis.
Data windowing function
Select the desired windowing function applied to the data for FFT analysis. Select
‘Blackman’ when sampling a non-coherent input signal or ‘Rectangle’ when sampling a
coherent input signal.
Test options
→
notch frequency bins
Select bins to be removed from the spectrum and back-filled with the average noise
level. May also customize which Harmonics/Spurs are considered in SNR and THD
calculations and select the method for calculating spur power.
Test options
→
analysis window
markers
Enable markers to narrow the Single-Tone FFT test analysis to a specific bandwidth.
Data capture options
→
capture options
Configure the number of contiguous samples per capture (capture depth). May also
enable Continuous Capture and FFT Averaging.