34
Field Name
Sample Value
Explanation
1. 1/5/15 Minutes
Load
0.83
Time interval for load averaging, colour of the diagram
2. Average
0.86
Average CPU load value over time interval (1/5/15 Minute)
3. Peak
1.50
Peak CPU load value of the time interval
6.7.3
Realtime Traffic
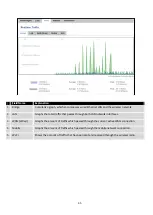
This graph illustrates average system inbound and outbound traffic over the course of ~3 minutes; each new
measurement is taken every 3 seconds. The graph consists out of two colors coded graphs (green graph shows the
outbound traffic, blue graph shows inbound traffic). Although not graphed, the page also displays peak loads and
average of inbound and outbound traffic.


