4 Using the control module
Clarity Controls
4.5 Data Acquisition window
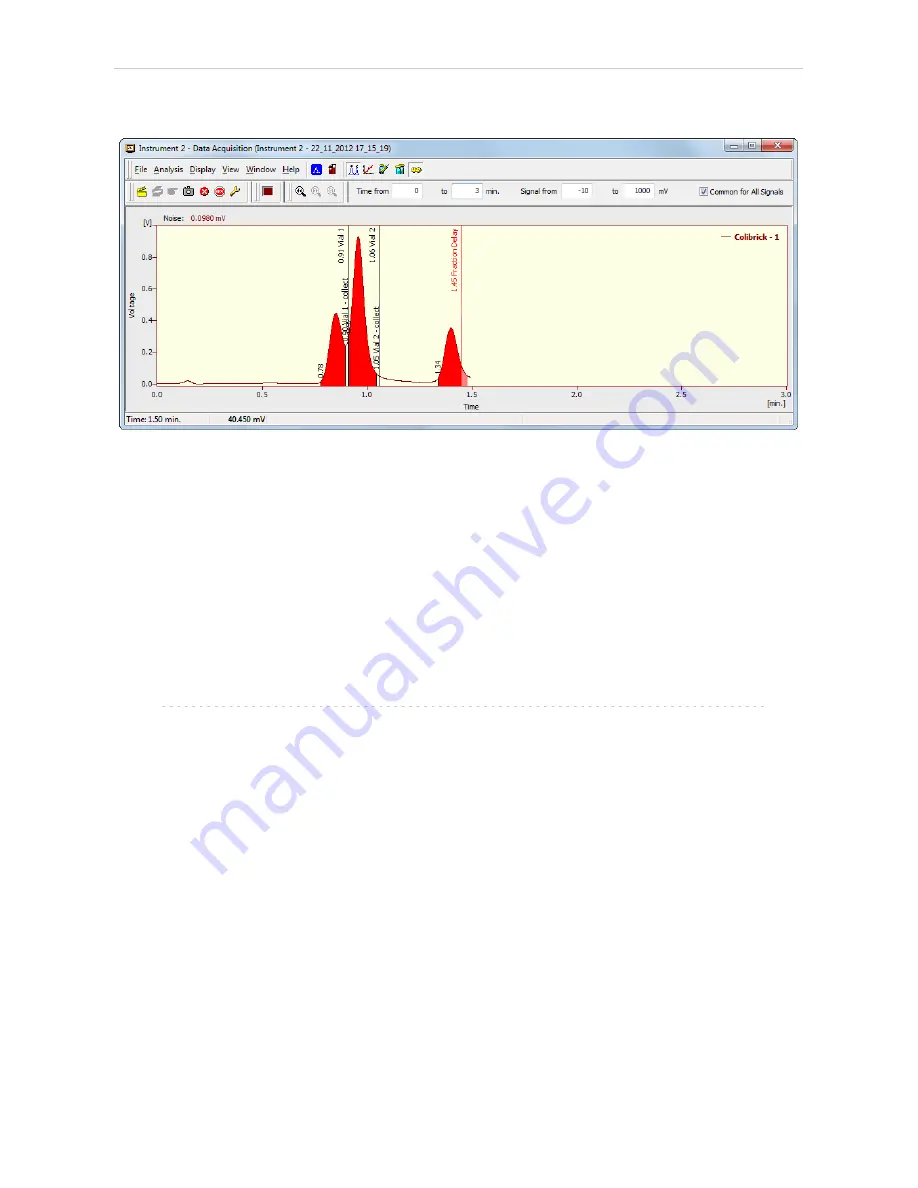
Fig 10: Data Acquisition window
The
Data Acquisition
window can display the fractions in the graph using
the background color and also the start and stop fraction events and
marker of the Fraction Delay. To see the fractions and markers right click
on the graph, select
Properties…
to open the
Graph Properties
dialog and
check the
Show Events
checkbox.
When the Fraction Delay is set, there will be two colors present in the
graph - lighter and darker red. The lighter red color shows the expected
duration of the fraction (which
Clarity
only presumes based on data points
it got so far), while the darker red color shows the placement of the real
fractions.
Note:
The Fraction Delay in the picture will appear if the
Delay Volume
field in
the
Method Setup - FC - Fraction Table
dialog is set to a nonzero value.
- 17 -


