EN11
12HR or 24HR time display.
Check the maximum and minimum values of
temperature
and humidity
Press once
“
MEM
”
button to check
the maximum and
minimum values of temperature and humidity.
The maximum minimum value resets itself every 24 hours.
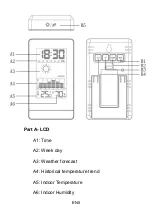
Temperature history
The bar graph displays the change of temperature for up to 12
hours, the timeline is in the bottom of the chart, the
temperature changes in °C or °F can be found on the left and
right side of the chart.
Comfort graphic
When the Humidity is less than 40% will show
When the Temperature at 20~25
℃
and the Humidity at the


