


SV 258 PRO User Manual
31
If you click the icon, this icon status information will be displayed:
Alert status: blue - everything is OK, red
– unregular event is happening.
Station connection status: green
– online; grey – offline; yellow - the station doesn’t respond
to the command for a long time.
Battery state. When you click this icon, information about charging level will be displayed.
External power source status: blue
– the instrument is powered by the external source, grey
- there is no external power.
Connection status. When you click this icon, information about connection with SvanNET
and a signal quality will be displayed.
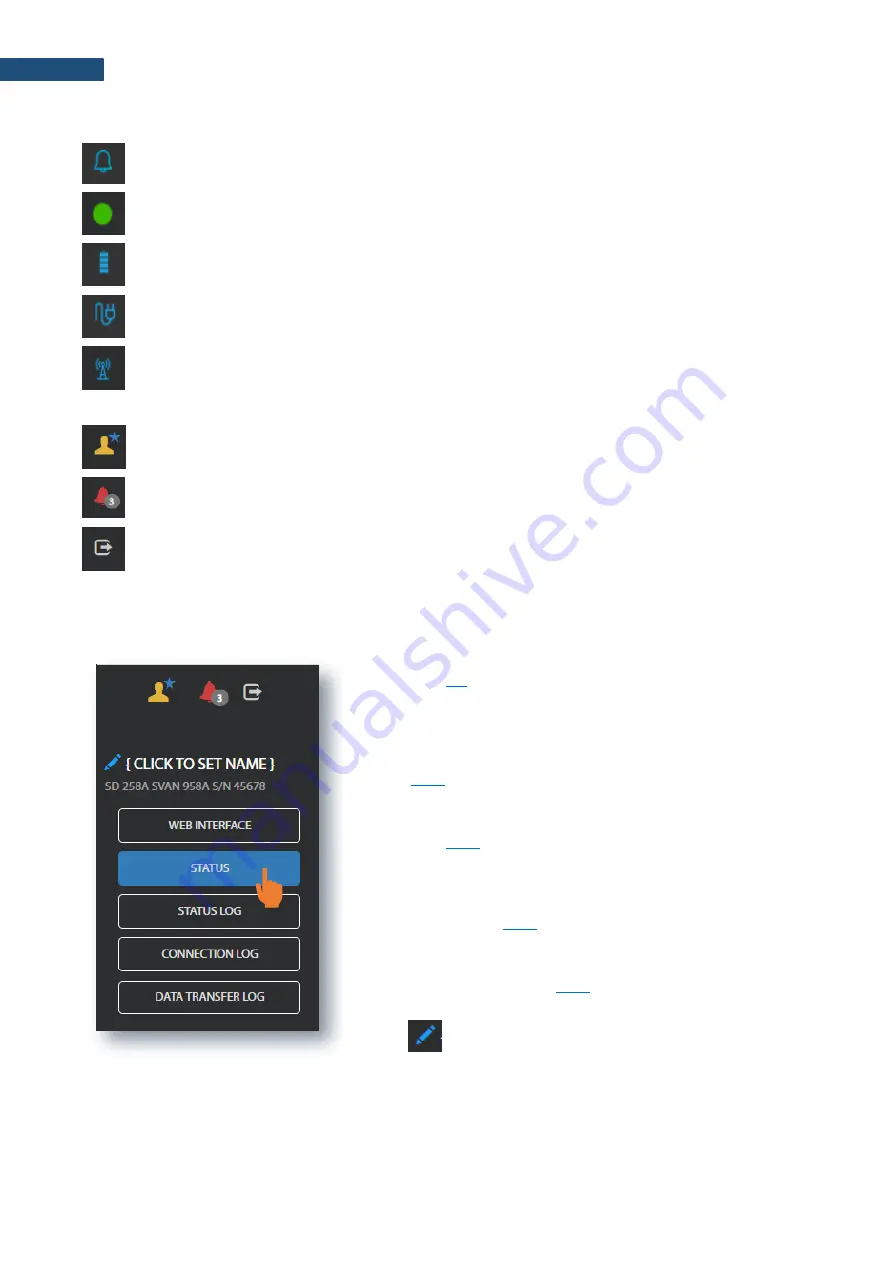
Three icons in the upper right-hand corner of the window allows you to:
manage the user account
display alarms for all stations
exit SvanNET.
The Tool panel provides some functions for station control. To switch the function, point cursor on the
appropriate button (it will change its colour to blue) and click it.
The
WEB INTERFACE
button switches you to the Live data view
(see Chapter
) in which you can view measurement results
and use additional tools to configure station parameters,
download data files and start/stop measurements. This button is
available for the stations connected to SvanNET.
The
STATUS
button switches you to the Station status view (see
Chapter
) in which you can check the station status and
configure status alarms.
The
STATUS LOG
button switches you to the Status log view
(see Chapter
) in which you can check the power source
(type and charge level), memory free space and mobile signal
quality.
The
CONNECTION LOG
button switches you to the Connection
) in which you can check the history
of station connections.
The
DATA TRANSFER LOG
button switches you to the Data
transfer log view (see Chapter
) in which you can check the
history of data transfers (uploads).
Clicking
you can set the new station name instead of the
default.


