15
Viewing the Graph
•
To zoom in:
Press the left mouse button and drag the cursor to
select the new area.
•
To zoom out:
Click “Undo Zoom”
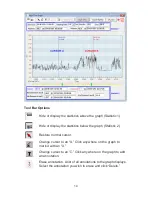
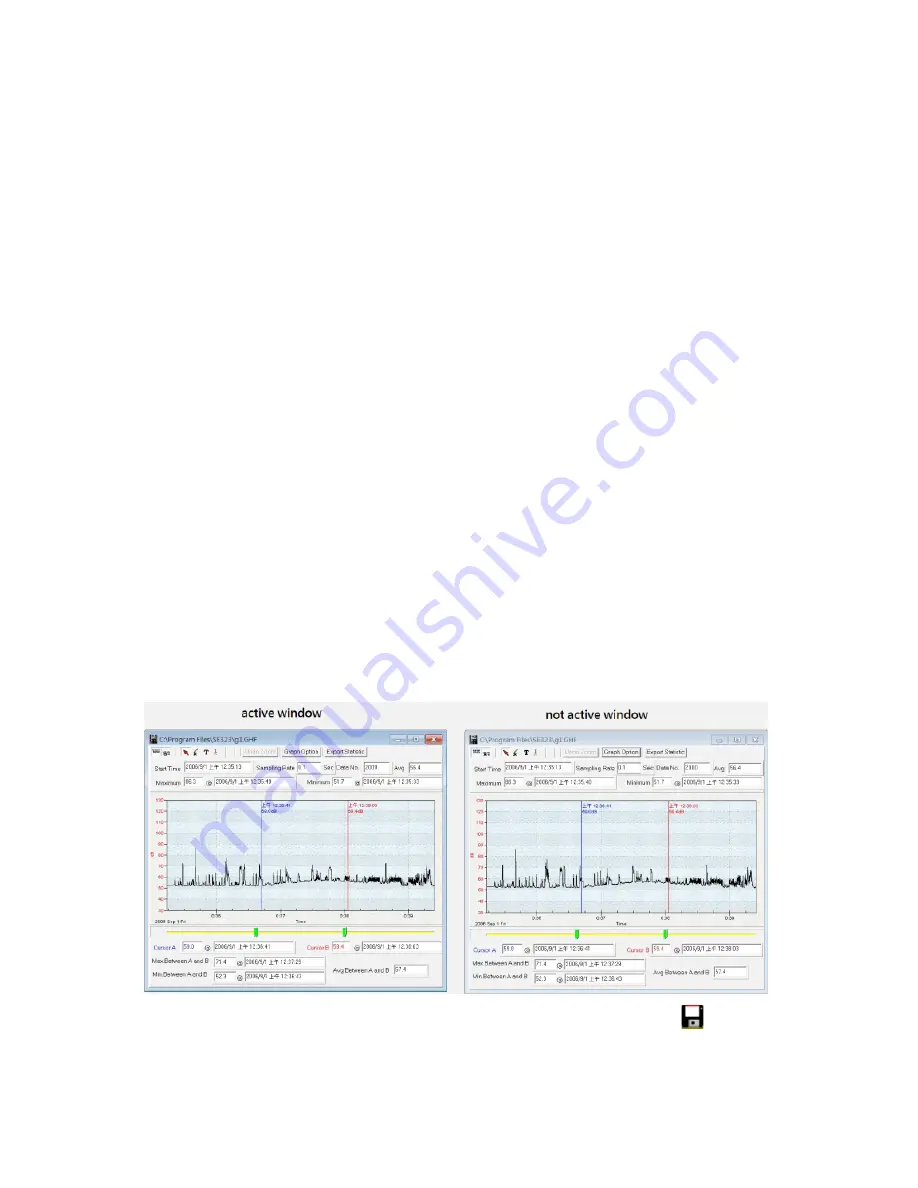
Detailed information on the two cursor points are located at the bottom
of the page. To move the cursors and view statistics for other points on
the graph:
1. Click on either of the green cursor indicators on the yellow bar under
the graph.
2. Drag the cursor left or right. Information for the new data point displays.
Customizing the Graph
Double click on the graph to open the Customization Menu. This allows
you to modify the graph style, add a title and subtitle, maximize the
graph, and export the graph to the clipboard, a file, or a printer.
Saving Real-Time Data
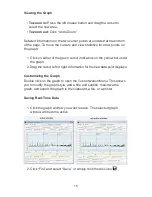
1. Click the graph window you want to save. The selected graph
window will become active.
2. Click “File” and select “Save,” or simply click the disc icon .


