Snap-on Cloud
Using the Snap-on Cloud
83
12.4.3 Navigating the Snap-on Cloud (Toolbars)
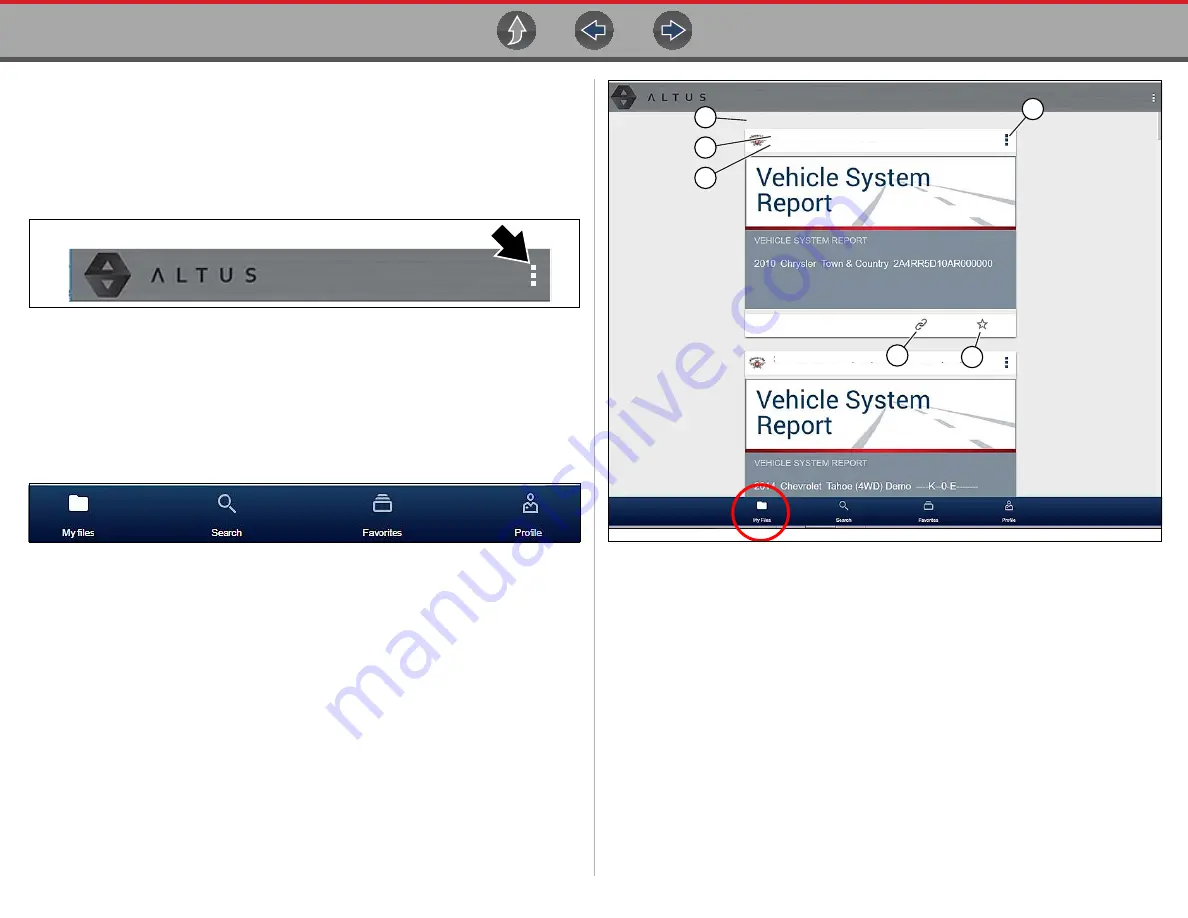
The upper and lower toolbars are available from all screens.
The upper toolbar includes a menu icon (right side) (
). This menu allows
you to share your entire gallery, see
Sharing all Reports (Share My Gallery)
Figure 12-5
The lower toolbar (
) includes the following links:
•
, see
•
, see
•
, see
•
, see
Figure 12-6
12.4.4 My Files
My Files displays all the code scan reports uploaded from the diagnostic tool
(
). Each report is displayed in a navigation card.
Figure 12-7
1— Report Upload Date
- Reports are displayed with the most recent uploads at
the top. The Report upload date is displayed at the upper left.
The date is shown once at the top of the series of reports, scroll up / down to
see all files within a specific date.
2— Report File Name
- See
for additional
information
.
3— Your Account Username (and timestamp)
- See
for
additional information.
The timestamp indicates the date/time the file posted.
4— Menu Icon
- options:
-
Download
- Select to download the report to your device.
-
Delete
- Select to delete the report.
5— Favorites Icon
for additional information.
6— Link icon
Sharing/E-mail an Individual Report (Link icon)
for additional information.
8/18/2018
4
1
2
3
MyAcct - 8/16/2018, 1:12:20 PM
2010 Chrysler Town & Country 3.8L V6 MPI
MyAcct - 8/16/2018, 1:12:20 PM
2014 Chevrolet Tahoe
6
5


