


7
5.
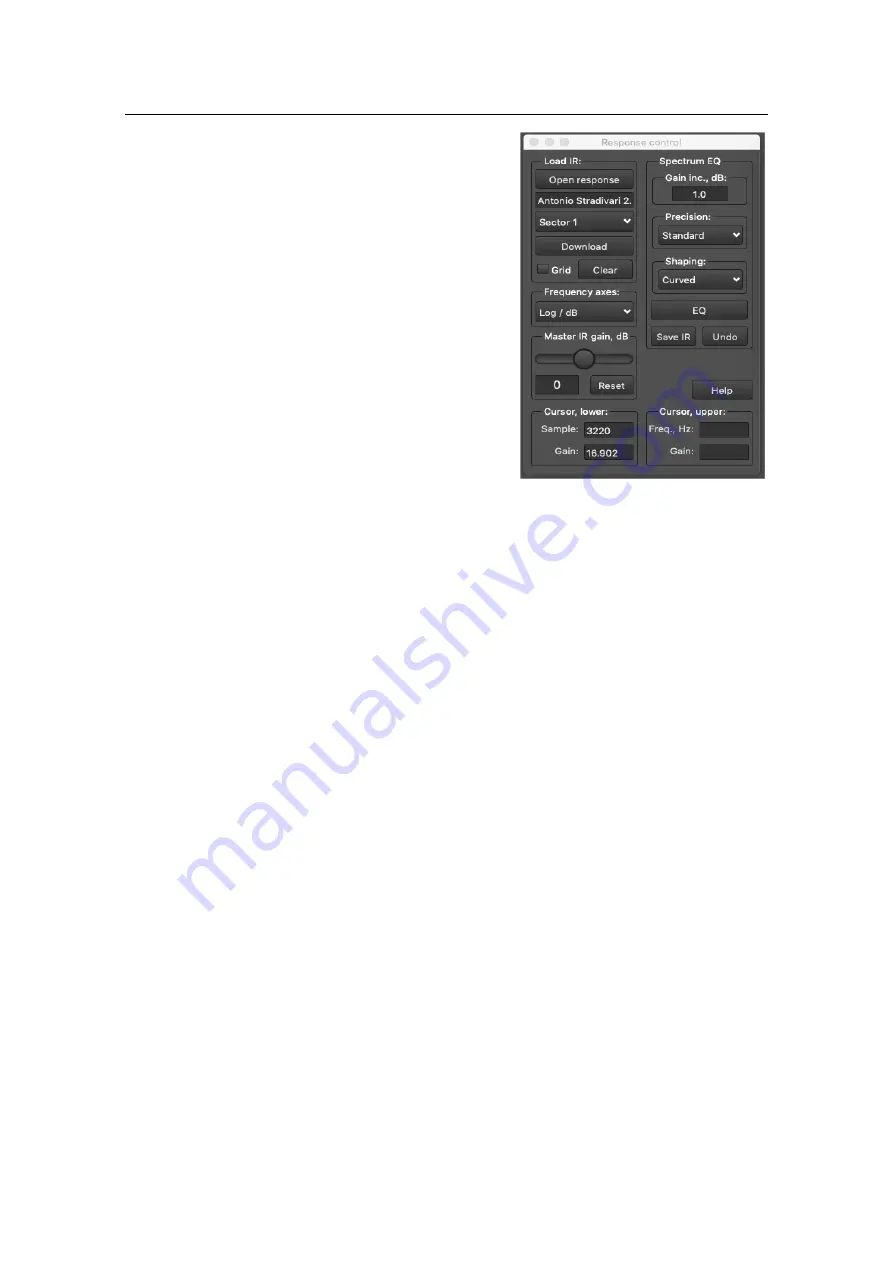
Response control
The Response Control window is the section of the software
that allows the user to open an impulse response and
download it to the hardware, as well as EQ the response
using the versatile EQ tool. The impulse response and its
spectrum are shown in the plot areas when loaded from
disc.
To open an impulse response file, simply click “Open
response
”
. The name of the file will appear in the text box
below this button.
To download the file, simply select any sector between 1
and 10 from the drop-down list
, and click “Download”. As
the file is being downloaded, the software will display the
message “Downloading impulse response…” Any existing
impulse response in the chosen sector will be overwritten.
The vsound pedal will automatically select the impulse
response after download. To choose other previously
downloaded responses, click the
“Select IR” button
from the
Notification and System window.
Note: any settings and responses that you select will be automatically saved and recalled each time
the device is switched on or reset.
The controls are summarised as follows:
•
Open response
–
opens an impulse response as a text file or a WAV (wave). The files supplied with
the software conform to a particular format, described under “About impulse responses”.
•
Download
–
downloads the impulse response to the chosen sector (1
–
10). The first 32 characters
of the title, will be used by vsound and appear in the “Select impulse response”
window.
•
Grid
–
toggles the grid on the frequency response and impulse response plots.
•
Clear
–
clears the impulse and frequency response plots and internally closes the associated
impulse response file.
•
Frequency axes
–
this drop-down list allows you to change the way the frequency response is
plotted. It does not affect the IR in any way, i.e. it is for visual purposes only.
•
Master IR gain, dB - this slider allows you to change the gain of the IR before you download it,
within a range of +20 dB to -20 dB. When vsound opens an IR, it automatically sets the gain to a
standard loudness. This can be overridden with this slider control. Clicking
the “Reset” button
returns the IR to its default (automatic) gain.
•
Cursor, lower
–
Shows the x and y position of the mouse when oved over the IR or frequency plot.
For the IR plot, this is sample v gain. For the frequency plot, this is frequency v gain.
•
Cursor, upper
–
Shows the x and y position of the mouse when the left button is held down (or
equivalent for the track pad) for the frequency plot. These windows are not used for the IR plot.
To zoom in on a region of the IR plot, move the cursor to a start point, hold down the left mouse
button (or mouse pad equivalent) and drag. Now release. The plot will zoom to this region. To
unzoom, drag anywhere on the IR plot from right to left. For the frequency plot, zooming is done
slightly differently. Select the region as before, which will become highlighted. Now click the “zoom”
button in the top-
right corner of the frequency plot. To unzoom, click the “unzoom” button.
The zoom
feature works differently for the IR and frequency plots because of the equalizer, which is discussed
next.


