EL-9600/9400 Graphing Calculator
Notes
Step & Key Operation
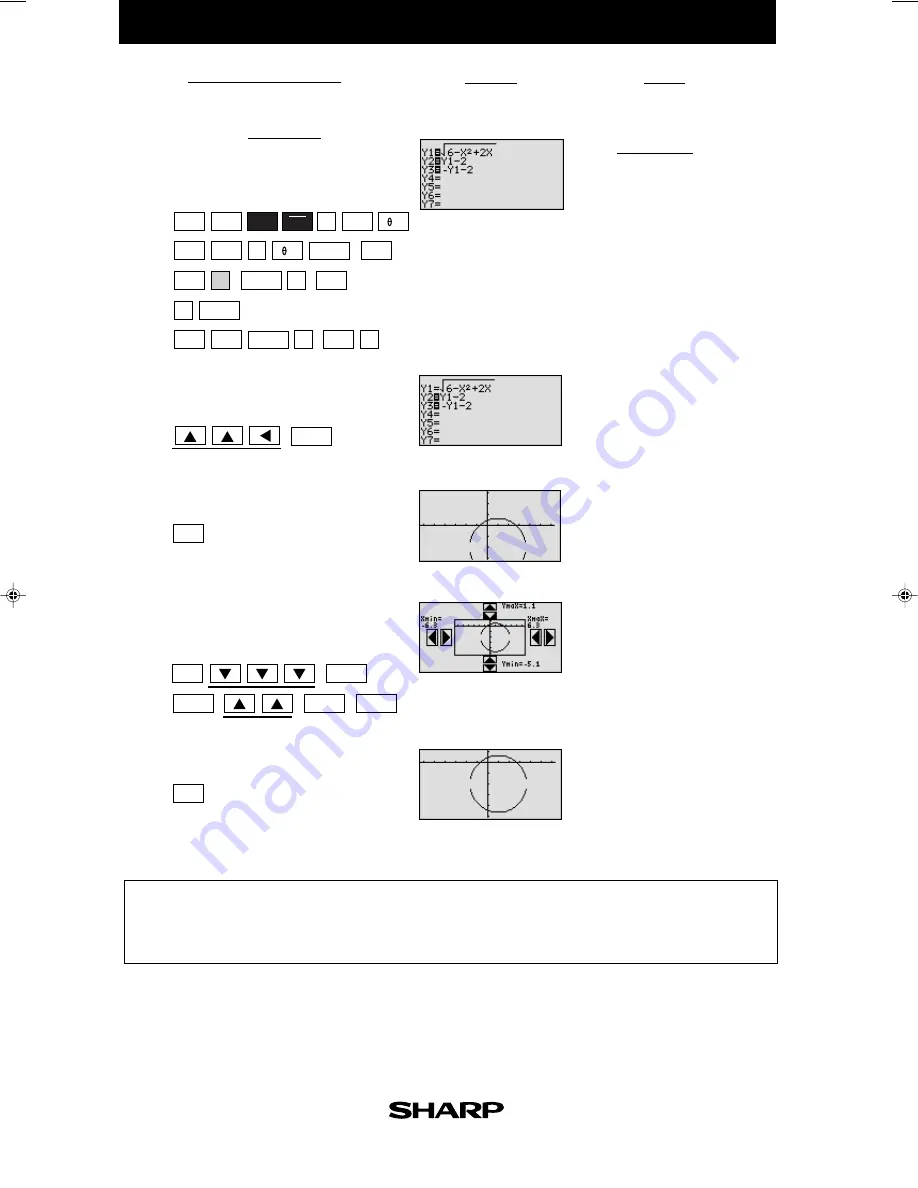
(When using EL-9600)
*Use either pen touch or cursor to operate.
Display
(When using EL-9600)
2
-
2
*
*
*
*
*
○ ○ ○ ○ ○ ○ ○ ○ ○ ○ ○ ○ ○ ○ ○ ○ ○ ○ ○ ○ ○ ○ ○ ○ ○ ○ ○ ○ ○ ○ ○ ○ ○ ○ ○ ○ ○ ○ ○ ○ ○ ○ ○ ○ ○ ○ ○ ○ ○ ○ ○ ○ ○ ○ ○ ○ ○ ○
Enter
y
=
√
6 -
x
2
+
2
x
for Y1,
y
= Y1 - 2 for Y2, and
y =
-Y1 -2 for
Y3.
Notice that if you enter
y
=
√
6 -
x
2
+
2
x
- 2 for Y1
and
y
= - Y1 for Y2, you will
not get the graph of a circle
because the “
±
” does not go
with the “-2”.
2
-
3
*
*
"Turn off" Y1 so that it will not
graph.
Notice that “=” for Y1 is no
longer darkened. You now
have the top portion and the
bottom portion of the circle
in Y2 and Y3.
2
-
4
View the graph.
2
-
5
*
*
*
*
*
*
Adjust the screen to see the bottom
part of the circle using the Rapid
feature.
2
-
6
View the graph in the new window.
Graphing circles can be performed easily on the calculator display. Also,
the Rapid Zoom feature of the EL-9600/9400 allows shifting and adjusting
display area (window) of a graph easily.
Wait until the graph is dis-
played after each operation.
(It takes few seconds to
graph)
10-2
GRAPH
GRAPH
ENTER
ENTER
ENTER
ENTER
EZ
ENTER
Y=
CL
6
(
-
)
+
—
VARS
ENTER
CL
ENTER
ENTER
ENTER
VARS
—
—
2
A
1
2
1
2
x
2
2nd F
√
X
/
/
T
/
n
X
/
/
T
/
n
HB1.DocD.
98.10.1, 6:15 PM
13


