10
│ 2 AQUAPHON system
−
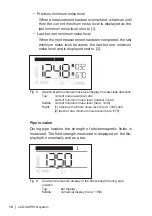
Previous minimum noise level
When a measurement has been completed, what was until
then the current minimum noise level is displayed as the
last minimum noise level next to [1].
−
Last but one minimum noise level
When the next measurement has been completed, the last
minimum noise level becomes the last but one minimum
noise level and is displayed next to [2].
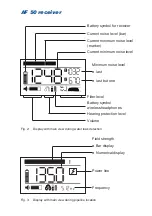
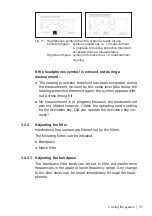
Fig. 5: Graphical and numerical noise level display for water leak detection
Top:
current noise level (bar) and
current minimum noise level (marker in bar)
Middle: current minimum noise level (here: 1248)
Right: [1] previous minimum noise level (here: 1032) and
[2] last but one minimum noise level (here: 670)
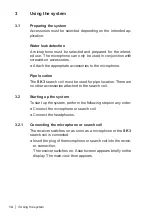
Pipe location
During pipe location the strength of electromagnetic fields is
measured. The field strength measured is displayed on the dis
-
play both numerically and as a bar.
Hz
Fig. 6:
Chart and numerical display of the field strength during pipe
location
Top:
bar display
Middle:
numerical display (
here:
1350)

