CorreluxView Software
33
6.6.3
Call up the correlation analysis menu
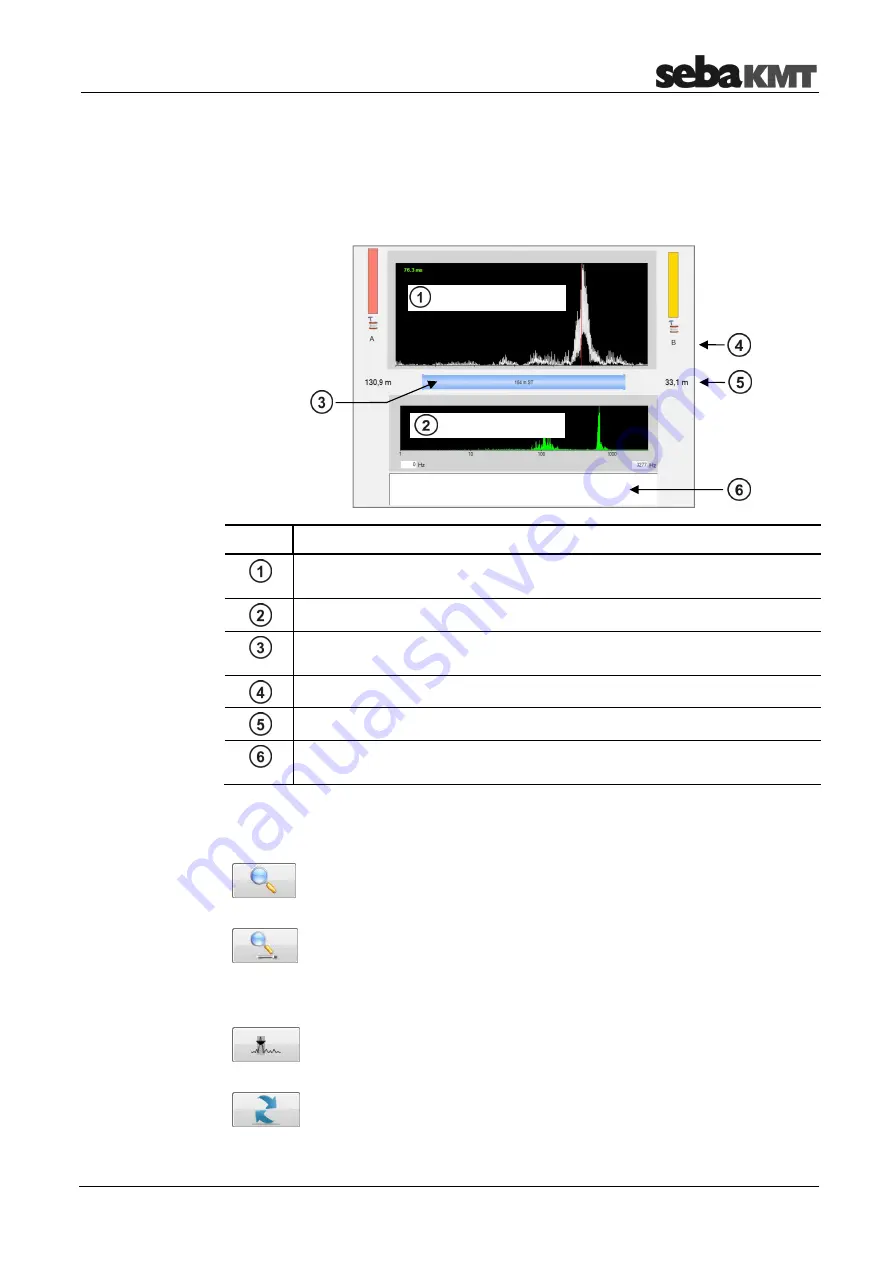
Once you click twice on a correlation displayed by CorreluxView, the analysis menu
appears which can be used to more closely examine the correlation.
The menu which opens is very similar to the Correlator's Correlation menu.
Element Description
Correlation curve
with the Lag value top left whose color indicates the quality of the correlation
Coherence curve
Pipeline between A and B
Tapping the graphic opens the menu for entering pipe parameters.
Sensor number
Distance from sensor to leak
Comment field
for notes on this correlation
The buttons for analyzing correlation curve and coherence will probably also be familiar
to you from your work with the Correlator.
Zoom
… To magnify a section of the correlation curve
Click on the button, then select the area in the diagram on which you want
to zoom.
Zoom opt.
… Click on the button to toggle between the following two
displays:
•
Display of the entire correlation range
•
Display of only that portion of the correlation curve which refers to
the pipe section between the two measuring points
Peak suppression
… To hide a section of the curve from view
Click on the button, then select the area in the diagram that you want to
suppress.
Reset
… Sets all analysis tools as well as the correlation curve back to
their initial states.
Call up analysis menu
Design
Tools
Correlation
Coherence
Summary of Contents for COR C-300-RI
Page 2: ...Consultation with SebaKMT 2...
Page 7: ...Terms of Warranty 7...
Page 24: ...The Multi sensors 24...


