15
A quick introduction
Your oscilloscope offers these possibilities:
❙ the definition of the display of 6 parameters which may
come from different sources
❙
a quick view of all important parameters of one source
using the Quick View function.
Please change the time base to 100 µs per scale division
and press the QUICKVIEW
10
key. You will see the follow-
ing display:
The following list features the most important parameters
of a signal:
❙ positive and negative peak voltages,
❙ rise and fall times,
❙
mean voltage.
10 additional parameters are shown below the grid:
❙ RMS,
peak-peak voltage,
❙ frequency,
period,
❙ amplitude,
number of rising edges,
❙
pos.
pulse width,
neg.
pulse width,
❙
pos.
duty cycle,
neg. duty cycle.
Thus by simply pressing a key you see 14 parameters at a
glance which characterize the signal. This function applies
always to the acutal active channel.
Fig. 3.8: Quick View parameter measurement
You see now a two-window
display: the display will show
in the top area the complete
captured signal, below an en-
larged portion. Use the time
base knob to select the
zoom
factor and the small knob for
horizontal positioning.
By pressing the ZOOM key
40
again the
zoom mode be will
be deactivated.
Fig. 3.6: ZOOM function
3 .4 Cursor measurements
After displaying the signal and its details we now proceed
to measuring it using the cursor functions. Press again
shortly AUTOSET
15
and then the CURSOR/MEASURE key
8
. Now the cursor menu will open up, and you can se-
lect the kind of cursor. Press the top soft key in order to
open the appropriate menu. Use the knob in the CURSOR/
MENU area for the selection by turning it CCW until the V-
marker is underlined, press the universal button or wait for
some seconds in order to accept the selection. Now two
cursors will be displayed along with the signal, and the
measurement results in the bottom area of the grid. Select
the active cursor by pushing the universal knob and posi
-
tion it by turning the knob.
The cursor measurement results will be displayed at the
bottom of the
grid. In this case the V-marker has selec-
ted the voltages at the two cursor positions, their diffe-
rence, and the time difference between the positions will
be shown. The cursors will be switched off by pressing the
CURSOR/MEASURE key and the associated Cursors off
soft key.
3 .5 Automatic measurements
In addition to cursor measurements the most important
signal parameters can be displayed.
Fig. 3.7: Cursor measurements
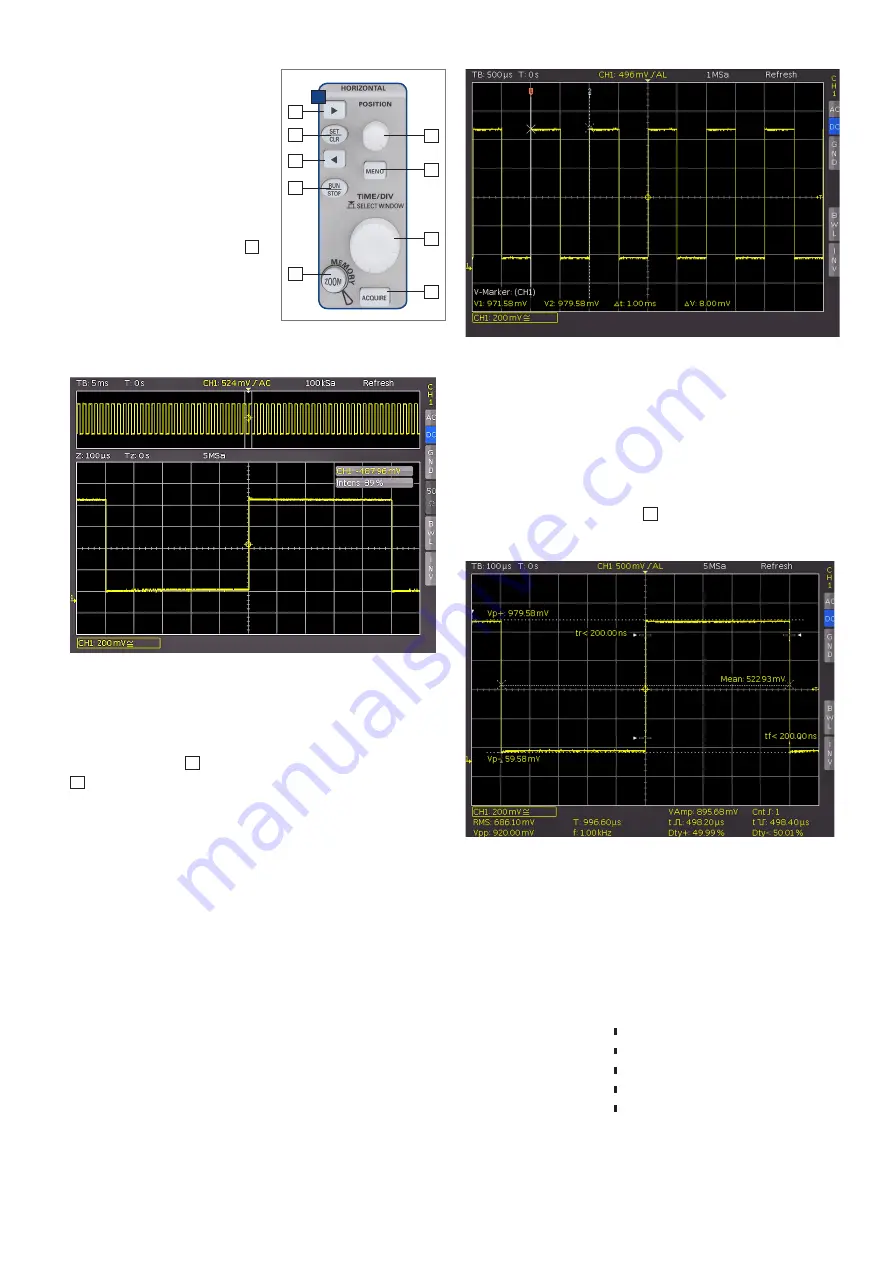
Fig. 3.5: Area of the control panel
containing the ZOOM knob
37
D
38
37
41
39
42
43
44
40


