10
revolution
Revolution Education Ltd. Web: www.picaxe.co.uk
Version 2.0 12/10
AXE110.PMD
PICAXE DATALOGGER
6) Retrieving Data from a Datalogging Mission.
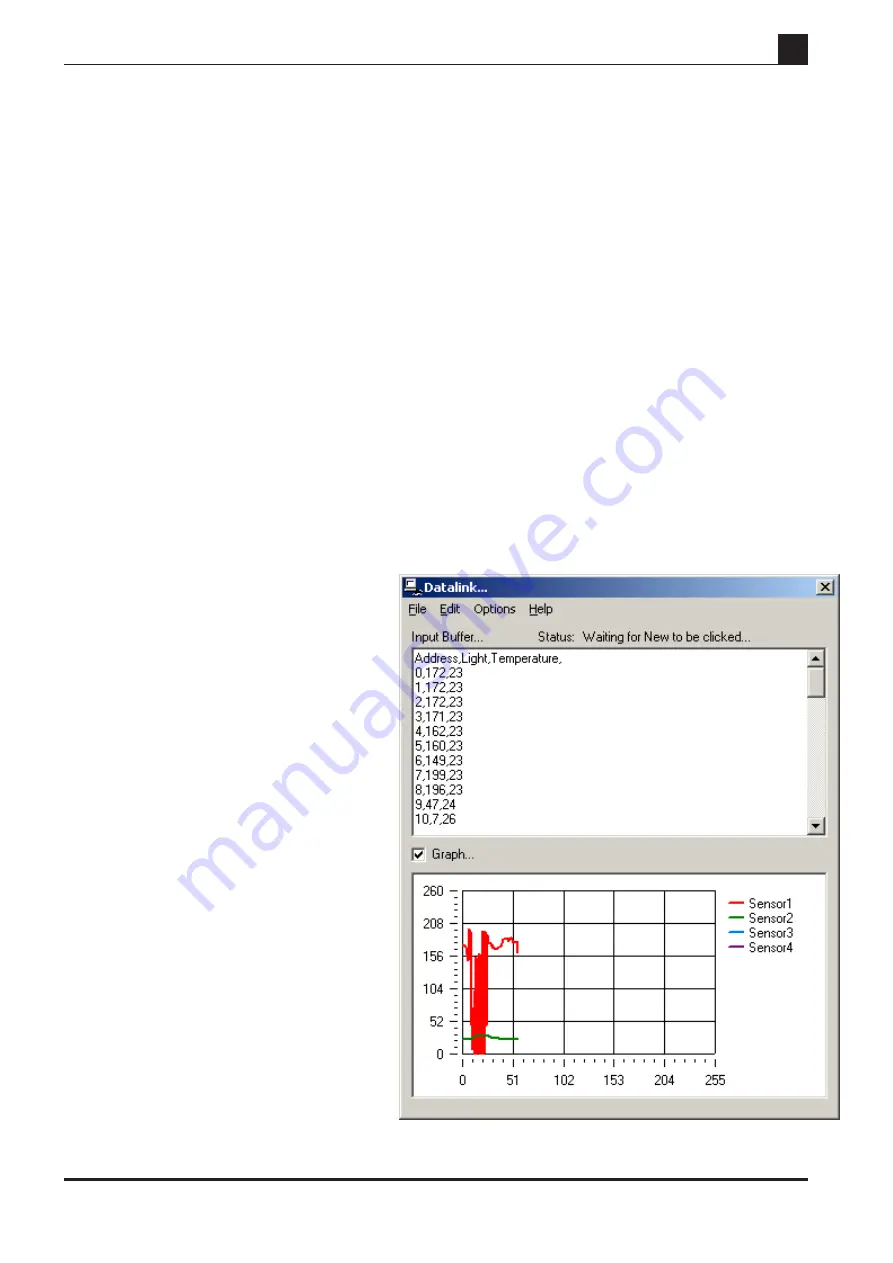
The ‘Datalink’ communications utility is used to retrieve mission data from the
AXE110 Datalogger module. The utility saves the data in CSV (comma separated
variable) format files, which can be opened in all common spreadsheet applications
(e.g. Microsoft Excel) for further analysis. The utility also includes the option to
automatically draw a graph of the data as it is uploaded (if required).
To use the ‘Datalink’ communications utility, a small BASIC program must be
running in the PICAXE microcontroller. This program reads the data from memory
and transmits it (via the ‘Datalink’ connector and serial cable) to the computer,
where it can be processed by the ‘Datalink’ utility. This BASIC program is always
automatically downloaded as part of a ‘New Datalogger Mission’ wizard program.
Note that the ‘Datalink’ utility uses the standard PICAXE cable to retrieve the data
from the datalogger module. However this cable must be inserted into the
‘Datalink’ socket (not the PICAXE ‘Run’ socket) for the ‘Datalink’ utility to function
correctly.
Note: If you are unsure whether the datalogger has the correct BASIC program
already running, a suitable program can be downloaded by using a program wizard
(use menu option PICAXE>Wizard>AXE110 Datalogger>Retrieve Unknown Data).
However this wizard should only be used if a normal datalogging program is not
already running (see the AXE110 datalogger
manual for further information).
Instructions on how to use the Datalink Utility:
1. Wait until the datalogger mission is complete
(status LED red).
2. Connect the PICAXE cable to the Datalink
socket on the datalogger.
3. Start the Programming Editor software.
4. Select PICAXE>Datalink menu (or press
<F9> shortcut key).
5. Select the Options menu. Make sure the
options are set to
Baud Rate
– 4800
Sensors
– (1 to 4 as appropriate)
Send G
– enabled
6. If you would like the software to
automatically draw a graph as data is
uploaded, make sure the graph is visible on
screen by selecting the ‘Graph…’ check box.
7. Click the File>New menu, and then follow
the on-screen instructions.
8. The data will then be uploaded, and is
immediately visible on screen. Once the data
upload is complete, click the File>Save As
menu to save the data as a CSV format text
file. This file can then be opened (if desired)
in other applications such as Microsoft Excel.


