18
Altering Graph Views
1. You may also enter the number of minutes to average and the percent drop below
baseline.
The program averages the values over the specified number of minutes (baseline) and
detects drops of the specified percentage below baseline.
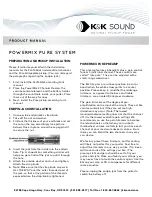
2. When viewing the pH graph, you can manipulate it in various ways to control
which information you view. The three buttons in the top right corner of the screen
perform various functions to allow this manipulation.
a.
The button on the left allows you to move the cursors along the X
axis. When the cursor rests on a point, it will display the time and
date, as well as the pH value of that point.
b.
The middle button provides six different functions:
These functions are the following:
Select one rectangular section of the graph to enlarge;
Select an area to stretch and enlarge along the X axis;
Select an area to stretch and enlarge along the Y axis;
Auto scale–Return to graph to its original configuration
Summary of Contents for Dx-pH Measurement System
Page 2: ...2 Dx pH Measurement System User s Manual Version X X August 2005...
Page 21: ...21...
Page 28: ...28 Click OK when the desired settings have been selected...
Page 32: ...32 Attachment A Patient Instructions...
Page 34: ...34...


