PM7000 Start Guide Issue 1 090608 40
It has six steps.
In the first step you have the opportunity to select the data streams you want to graph. ‘P’ on the
left hand side in the above example refers to Point Store. The Factory set up in your new PM7000
will show red ‘A’s, as the recording mode is Adaptive Store.
Below these ‘detailed channels’ in the ‘graph assistant’ list will always be found the entries labelled
‘G’ (green) for General Parameters, and ‘T’ (blue) if there are waveform recordings present. The
‘detailed channels’ are the troubleshooting channels, either Adaptive Store or Point Store. The
‘detailed channels’ will be selected automatically for you within the ‘graph assistant’. We have
taken the view that as you especially selected these parameters, you are particularly interested in the
results from them.
An account of the ‘Storage Regimes’ in the PM7000 is given in the manual.
The other five steps enable you to format the graphs in different ways. You will want to familiarize
yourself with the choices at a later stage.
Go straight to ‘Finish’ for this ‘Start’ activity.
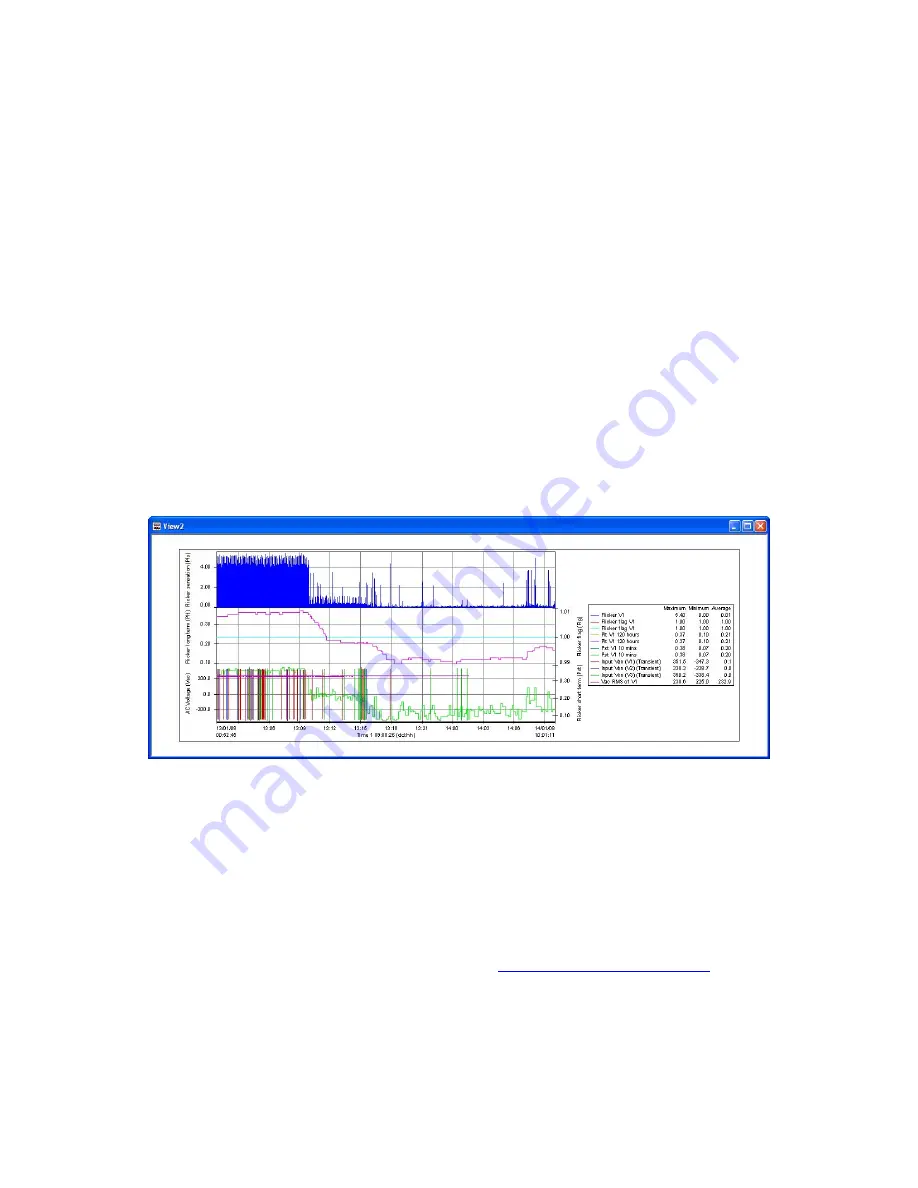
Here is an example of a graph you might produce. Each different graph is called a ‘view’. As just
mentioned you can play around with the different ways of formatting it and adding text. ‘How to
zoom in’ and other facilities are covered in the Pronto video and manual.
Enjoy your PM7000. For further help see the PM7000 Manual or the Pronto for Windows Manual
on your customer CD or contact your distributor, Synergy Systems Inc,
or Outram Research Ltd on +44 (0)1243 573050, email
, website
www.outramresearch.co.uk


