background image

Configuration

R&S

®

FSV/A3000 I/Q


Analyzer

51

User Manual 1178.8536.02 ─ 01

5.3.1


Input Source Settings

Access

: "Overview" > "Input/Frontend" > "Input Source"

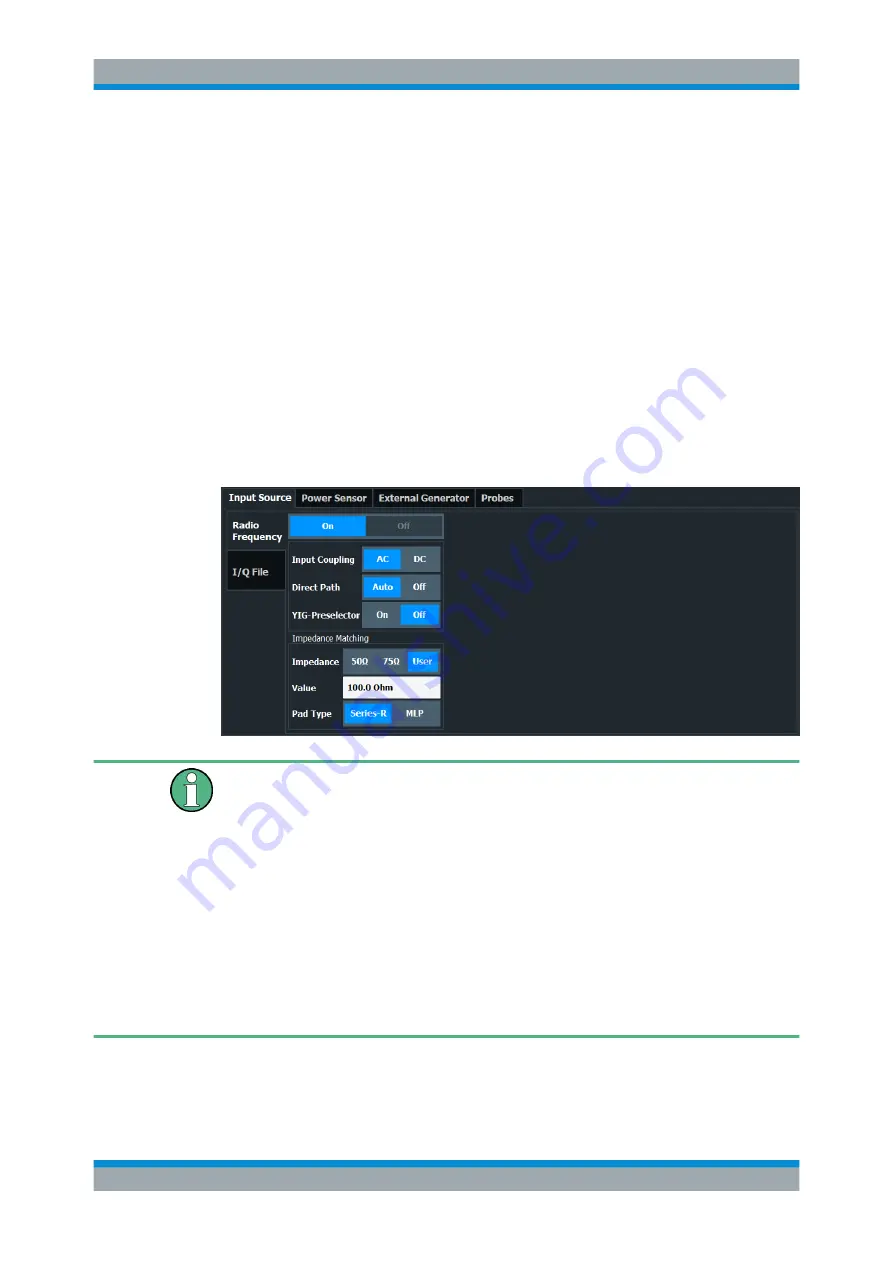
The input source determines which data the R&S


FSV/A will analyze.

The default input source for the R&S


FSV/A is "Radio Frequency" , i.e. the signal at the

"RF Input" connector of the R&S


FSV/A. If no additional options are installed, this is the

only available input source.

Radio Frequency Input

............................................................................................51

Settings for Input from I/Q Data Files

......................................................................53

Probe Settings

.........................................................................................................54

External Generator Control Settings

....................................................................... 56

5.3.1.1


Radio Frequency Input

Access

: "Overview" > "Input/Frontend" > "Input Source" > "Radio Frequency"

RF Input Protection

The RF input connector of the R&S


FSV/A must be protected against signal levels that

exceed the ranges specified in the data sheet. Therefore, the R&S


FSV/A is equipped

with an overload protection mechanism for DC and signal frequencies up to 30


MHz.

This mechanism becomes active as soon as the power at the input mixer exceeds the
specified limit. It ensures that the connection between RF input and input mixer is cut
off.
When the overload protection is activated, an error message is displayed in the status
bar ( "INPUT OVLD" ), and a message box informs you that the RF Input was discon-
nected. Furthermore, a status bit (bit 3) in the 

STAT:QUES:POW

 status register is set.

In this case you must decrease the level at the RF input connector and then close the
message box. Then measurement is possible again. Reactivating the RF input is also
possible via the remote command 

INPut<ip>:ATTenuation:PROTection:RESet

.

Data Input and Output Settings

Summary of Contents for FSV3000 Series

Page 1: ...R S FSV A3000 I Q Analyzer and I Q Input Interfaces User Manual User Manual Version 01 1178853602 ÜãT2 ...

Page 2: ...lectronic attenuator 1330 4078 02 R S FSV3 B40 40 MHz analysis bandwidth extension 1330 4103 02 R S FSV3 B200 200 MHz analysis bandwidth extenstion 1330 4132 02 R S FSV3 B400 400 MHz analysis bandwidth extenstion 1330 7154 02 R S FSV3 U400 1330 7183 02 2019 Rohde Schwarz GmbH Co KG Mühldorfstr 15 81671 München Germany Phone 49 89 41 29 0 Fax 49 89 41 29 12 164 Email info rohde schwarz com Internet...

Page 3: ...Q Data from RF Input 17 4 2 Using Probes 21 4 3 Basics on External Generator Control 24 4 4 Basics on Input from I Q Data Files 35 4 5 IF and Video Signal Output 36 4 6 Receiving and Providing Trigger Signals 36 4 7 I Q Data Import and Export 37 4 8 Basics on FFT 38 5 Configuration 45 5 1 Configuration Overview 45 5 2 Import Export Functions 47 5 3 Data Input and Output Settings 50 5 4 Amplitude 6...

Page 4: ...nalyzer Measurements 134 8 4 Configuring I Q Analyzer Measurements 139 8 5 Configuring the Result Display 202 8 6 Capturing Data and Performing Sweeps 210 8 7 I Q Analysis 216 8 8 Retrieving Results 264 8 9 Importing and Exporting I Q Data and Results 275 8 10 Programming Examples 276 8 11 Deprecated Commands 279 Annex 281 A Formats for Returned Values ASCII Format and Binary Format 283 B Referenc...

Page 5: ...t 1 1 2 User Manuals and Help Separate user manuals are provided for the base unit and the firmware applications Base unit manual Contains the description of all instrument modes and functions It also provides an introduction to remote control a complete description of the remote control com mands with programming examples and information on maintenance instrument interfaces and error messages Inc...

Page 6: ...elivered with the instrument 1 1 6 Data Sheets and Brochures The data sheet contains the technical specifications of the R S FSV A It also lists the firmware applications and their order numbers and optional accessories The brochure provides an overview of the instrument and deals with the specific char acteristics See www rohde schwarz com brochure datasheet FSV3000 1 1 7 Release Notes and Open S...

Page 7: ...g I Q data in general Configuration and Analysis A concise description of all functions and settings available to import capture and analyze I Q data in the I Q Analyzer with or without optional interfaces with their corresponding remote control command How to Work with I Q Data The basic procedure to perform an I Q Analyzer measurement with step by step instructions Optimizing and Troubleshooting...

Page 8: ...ative methods may be available to per form the same task In this case the procedure using the touchscreen is described Any elements that can be activated by touching can also be clicked using an addition ally connected mouse The alternative procedure using the keys on the instrument or the on screen keyboard is only described if it deviates from the standard operating pro cedures The term select m...

Page 9: ...as in the base unit and are described in the R S FSV A User Manual The latest version is available for download at the product homepage http www rohde schwarz com product FSVA3000 Additional information Several application notes discussing I Q analysis are available from the Rohde Schwarz website 1EF85 Converting R S I Q data files 1EF92 Wideband Signal Analysis 1MA257 Wideband mm Wave Signal Gene...

Page 10: ...the avail able memory on the instrument Only one measurement can be performed at any time namely the one in the currently active channel However in order to perform the configured measurements consecu tively a Sequencer function is provided If activated the measurements configured in the currently defined channels are per formed one after the other in the order of the tabs The currently active mea...

Page 11: ...el bar for the I Q Analyzer application Ref Level Reference level m el Att Mechanical and electronic RF attenuation Ref Offset Reference level offset Freq Center frequency Meas Time Measurement time Rec Length Defined record length number of samples to capture SRate Defined sample rate for data acquisition RBW Spectrum evaluation only Resolution bandwidth calculated from the sample rate and record...

Page 12: ...color 4 Trace number 5 Detector 6 Trace mode Diagram footer information The information in the diagram footer beneath the diagram depends on the evalua tion Center frequency Number of sweep points Range per division x axis Span Spectrum Status bar information Global instrument settings the instrument status and any irregularities are indicated in the status bar beneath the diagram Furthermore the ...

Page 13: ...me including several graphical diagrams marker tables or peak lists For details on working with the SmartGrid see the R S FSV A Getting Started manual Measurements in the time and frequency domain The time and frequency domain measurements and the available results are described in detail in the R S FSV A User Manual Result displays for I Q data Magnitude 13 Spectrum 13 I Q Vector 14 Real Imag I Q...

Page 14: ...an I Q plot The samples are connected by a line Note For the I Q vector result display the number of I Q samples to record Record Length must be identical to the number of trace points to be displayed Sweep Points for I Q Analyzer 10001 For record lengths outside the valid range of sweep points the diagram does not show valid results Remote command LAY ADD WIND 1 RIGH VECT see LAYout ADD WINDow on...

Page 15: ...ong marker tables simply scroll through the entries with your finger on the touchscreen Remote command LAY ADD 1 RIGH MTAB see LAYout ADD WINDow on page 204 Results CALCulate n MARKer m X on page 235 CALCulate n MARKer m Y on page 274 Marker Peak List The marker peak list determines the frequencies and levels of peaks in the spectrum or time domain How many peaks are displayed can be defined as we...

Page 16: ...178 8536 02 01 Tip To navigate within long marker peak lists simply scroll through the entries with your finger on the touchscreen Remote command LAY ADD 1 RIGH PEAK see LAYout ADD WINDow on page 204 Results CALCulate n MARKer m X on page 235 CALCulate n MARKer m Y on page 274 ...

Page 17: ...Files 35 IF and Video Signal Output 36 Receiving and Providing Trigger Signals 36 I Q Data Import and Export 37 Basics on FFT 38 4 1 Processing Analog I Q Data from RF Input Complex baseband data In the telephone systems of the past baseband data was transmitted unchanged as an analog signal In modern phone systems and in radio communication however the baseband data is modulated on a carrier freq...

Page 18: ...e in the R S FSV A for a maximum of 400 Msamples 400 1000 1000 of complex samples pairs of I and Q data The num ber of complex samples to be captured can be defined for restrictions refer to Chap ter 4 1 1 Sample Rate and Maximum Usable I Q Bandwidth for RF Input on page 18 The block diagram in Figure 4 1 shows the analyzer hardware from the IF section to the processor Figure 4 1 Block diagram ill...

Page 19: ...ncluded in the initial installation B options or updated later U options The maximum bandwidth provided by the individual option is indicated by its number for example B40 extends the band width to 40 MHz As a rule the usable I Q bandwidth is proportional to the output sample rate Yet when the I Q bandwidth reaches the bandwidth of the analog IF filter at very high output sample rates the curve br...

Page 20: ...able I Q bandwidth and output sample rate with and without bandwidth extensions 4 1 1 3 R S FSV A Without Additional Bandwidth Extension Options Sample rate 100 Hz 10 GHz Maximum I Q bandwidth 10 MHz Table 4 1 Maximum I Q bandwidth Sample rate Maximum I Q bandwidth 100 Hz to 10 MHz Proportional up to maximum 10 MHz 10 MHz to 10 GHz 10 MHz 4 1 1 4 R S FSV A with I Q Bandwidth Extension Option B40 o...

Page 21: ... very flexibly and precisely on all sorts of devices to be tested without interfering with the signal The R S FSV A base unit and some optional applications support input from probes Probe connectors Active probes When using active probes from the R S RT family consider the following Active probes require operating power from the instrument and have a proprietary interface to the instrument The pr...

Page 22: ...adapter to the RF Input connector on the R S FSV A 2 Connect the R S RT ZA9 adapter s USB cable to a USB connector on the R S FSV A 3 Connect the probe to the adapter Probes are automatically detected when you plug them into the R S FSV A The detected information on the probe is displayed in the Probes tab of the Input dialog box To determine whether the probe has been connected properly and recog...

Page 23: ...e between the positive and negative input terminal CM Mode Common mode input voltage Vcm Mean voltage between the positive and negative input terminal vs ground The R S FSV A supports all probe modes The mode is configured in the Chap ter 5 3 1 3 Probe Settings on page 54 Offset compensation The R S RT ZM probes feature a comprehensive offset compensation function The compensation of DC components...

Page 24: ...ged the offsets for the P mode and N mode are adapted accordingly and vice versa 4 3 Basics on External Generator Control Some background knowledge on basic terms and principles used for external genera tor control is provided here for a better understanding of the required configuration set tings External generator control is only available in the following applications Spectrum Analyzer I Q Anal...

Page 25: ...al Generator Control option Using the TTL interface allows for considerably higher measurement rates than pure GPIB control because the frequency stepping of the R S FSV A is directly coupled with the frequency stepping of the generator For details see Chapter 4 3 7 Coupling the Frequencies on page 31 In Figure 4 3 the connection for an R S SMW is shown R S SMW rear panel R S FSW rear panel BNC Bl...

Page 26: ...he functions of the external generator an appropriate generator must be connected and configured correctly In particular the generator output must be con nected to the RF input of the R S FSV A External reference frequency In order to enhance measurement accuracy a common reference frequency should be used for both the R S FSV A and the generator If no independent 10 MHz reference frequency is ava...

Page 27: ... SMR 20 GHz SMR20 20 GHz SMB100A20 X 20 GHz SMR20B11 3 X 3 GHz SMB100A3 X 27 GHz SMR27 X 40 GHz SMB100A40 X 27 GHz SMR27B11 3 X SMBV100A 3 GHz SMBV100A3 X 30 GHz SMR30 X 6 GHz SMBV100A6 X 30 GHz SMR30B11 3 X SMB100B 1 GHz SMB100B1 X 40 GHz SMR40 X 3 GHz SMB100B3 X 40 GHz SMR40B11 3 X 6 GHz SMB100B6 X 50 GHz SMR50 X SMBV100B 3 GHz SMBV100B3 X 50 GHz SMR50B11 3 X 6 GHz SMBV100B6 X 60 GHz SMR60 X SMC...

Page 28: ...rsion V1 10 x or higher on the signal generator 3 Requires the option SMR B11 on the signal generator 4 Requires firmware version V3 20 200 or higher on the signal generator 4 3 3 Generator Setup Files For each signal generator type to be controlled by the R S FSV A a generator setup file must be configured and stored on the R S FSV A The setup file defines the fre quency and power ranges supporte...

Page 29: ...evel one for each sweep point The measured offsets can then be used as calibration factors for subsequent measurement results The calibration can be performed using either transmission or reflection measure ments The selected type of measurement used to determine the reference trace is included in the reference dataset 4 3 5 Normalization Once the measurement setup has been calibrated and the refe...

Page 30: ...race is also displayed in the spectrum diagram by default at the top of the diagram 100 of the window height It is indicated by a red line labeled NOR followed by the current reference value However it can be shifted ver tically to reflect an attenuation or gain caused by the measured DUT see also Shifting the reference line and normalized trace on page 31 Restoring the calibration settings If the...

Page 31: ...he range and the scaling of the y axis just as the refer ence level does The normalized reference trace 0 dB directly after calibration is displayed on this ref erence line indicated by a red line in the diagram By default the reference line is dis played at the top of the diagram If you shift the reference line the normalized trace is shifted as well Shifting the reference line and normalized tra...

Page 32: ...generator The default setting is 0 Hz Offsets other than 0 Hz are indicated by the FRQ label in the channel bar see also Chapter 4 3 8 Displayed Information and Errors on page 34 Swept frequency range The FAnalyzer values for the calibration sweep start with the start frequency and end with the stop frequency defined in the Frequency settings of the R S FSV A The result ing output frequencies Resu...

Page 33: ...surement rates than pure GPIB control because the frequency stepping of the R S FSV A is directly coupled with the frequency stepping of the generator Reverse sweep The frequency offset for automatic coupling can be used to sweep in the reverse direc tion To do so define a negative offset in the external generator measurement configu ration Note that the frequency is defined as the unsigned value ...

Page 34: ... and error messages may occur during external generator control Message Description Ext Generator GPIB Handshake Error Ext Generator TCPIP Handshake Error Ext Generator TTL Handshake Error Connection to the generator is not possible e g due to a cable damage or loose connection or wrong address Ext Generator Limits Exceeded The allowed frequency or power ranges for the generator were exceeded Reve...

Page 35: ...put source for the application For example you can capture I Q data using the I Q Analyzer application store it to a file and then analyze the signal parameters for that data later using the Pulse applica tion if available The I Q data must be stored in a format with the file extension iq tar For a detailed description see Chapter C I Q Data File Format iq tar on page 286 An application note on co...

Page 36: ...illed up or omitted at the end of the capture buffer 4 5 IF and Video Signal Output The measured IF signal or displayed video signal i e the filtered and detected IF sig nal can be provided at the IF output connector of the R S FSV A The IF output is a signal of the measured level at a specified frequency Restrictions Note the following restrictions for data output IF and video output is only avai...

Page 37: ... the output Level setting e g for Level High a constant high signal is output to the connector until the Send Trig ger button is selected Then a low pulse is provided 4 7 I Q Data Import and Export Baseband signals mostly occur as so called complex baseband signals i e a signal representation that consists of two channels the in phase I and the quadrature Q channel Such signals are referred to as ...

Page 38: ...ast Fourier Transformation is per formed which converts a vector of input values into a discrete spectrum of frequencies t s FFT f Hz 4 8 1 Window Functions The Fourier transformation is not performed on the entire captured data in one step Only a limited number of samples is used to calculate an individual result This process is called windowing After sampling in the time domain each window is mu...

Page 39: ...two tones with almost equal amplitudes and a small fre quency distance Blackman Harris default Good Good Good Harmonic detection and spurious emission detection Gauss Alpha 0 4 Good Good Good Weak signals and short duration Flattop Worst Best Good Accurate single tone measurements 5 Term Good Good Best Measurements with very high dynamic range 4 8 2 Overlapping The I Q Analyzer calculates multiple...

Page 40: ...r Auto FFT mode an FFT length of 4096 and a window length of 4096 or the record length if shorter is used to calculate the spectrum Combining results trace detector If the record length permits multiple overlapping windows are calculated and combined to create the final spectrum using the selected trace detector If necessary the trace detector is also used to reduce the number of calculated freque...

Page 41: ...arrow keys or the rotary knob to change the FFT length the value is incremented or decremented by powers of 2 If you enter the value manually any integer value from 3 to 524288 is available If the FFT length is longer than the Window Length the sample data is filled up with zeros up to the FFT length The FFT is then performed using interpolated frequency points For an FFT length that is not a powe...

Page 42: ...n into consideration The maximum RBW is restricted by the Analysis Bandwidth or by the following equa tion whichever is higher 3 Rate Sample Bandwidth Normalized RBWmax If a higher spectral resolution is required the number of samples must be increased by using a higher sample rate or longer record length The minimum achievable RBW depends on the sample rate and record length accord ing to the fol...

Page 43: ...ed by the advanced FFT parameters depending on the selected FFT Calculation Methods method 4 8 5 FFT Calculation Methods FFT calculation can be performed using different methods Single In single mode one FFT is calculated for the entire record length that means the win dow length is identical to the record length If the defined FFT Length is larger than the record length zeros are appended to the ...

Page 44: ...Basics on I Q Data Acquisition and Processing R S FSV A3000 I Q Analyzer 44 User Manual 1178 8536 02 01 Figure 4 8 FFT parameters for averaged FFT calculation Basics on FFT ...

Page 45: ...d to perform these tasks are described in Chapter 8 Remote Commands to Perform Measurements with I Q Data on page 128 Importing and Exporting I Q Data The I Q data to be evaluated in the I Q Analyzer application can not only be captured by the I Q Analyzer itself it can also be imported to the R S FSV A provided it has the correct format Furthermore the captured I Q data from the I Q Analyzer can ...

Page 46: ... the Overview provides quick access to the main settings dialog boxes The individual configuration steps are displayed in the order of the data flow Thus you can easily configure an entire channel from input over processing to output and analysis by stepping through the dialog boxes as indicated in the Overview The Overview for the I Q Analyzer provides quick access to the following configura tion...

Page 47: ... to its default values and thus closes all channels on the R S FSV A except for the default channel Remote command SYSTem PRESet CHANnel EXEC on page 138 Specific Settings for The channel may contain several windows for different results Thus the settings indi cated in the Overview and configured in the dialog boxes vary depending on the selected window Select an active window from the Specific Se...

Page 48: ...le in continuous sweep mode For more information about importing I Q data files see Chapter 5 3 1 2 Settings for Input from I Q Data Files on page 53 Import 48 Export 48 Export Trace to ASCII File 48 File Type 49 Decimal Separator 50 Trace Export Configuration 50 I Q Export 50 Import Access Save Recall Import Provides functions to import data For more information about importing I Q data files see...

Page 49: ...l storage location such as a USB memory device For details see Protecting Data Using the Secure User Mode in the Data Manage ment section of the R S FSV3000 FSVA3000 base unit user manual Remote command MMEMory STORe n TRACe on page 273 File Type Export Trace to ASCII File Export Determines the format of the ASCII file to be imported or exported Depending on the external program in which the data ...

Page 50: ...tes can exceed the available internal storage space on the R S FSV A In this case it can be necessary to use an external storage medium Note Secure user mode In secure user mode settings that are stored on the instrument are stored to volatile memory which is restricted to 256 MB Thus a memory limit reached error can occur although the hard disk indicates that storage space is still available To s...

Page 51: ...t be protected against signal levels that exceed the ranges specified in the data sheet Therefore the R S FSV A is equipped with an overload protection mechanism for DC and signal frequencies up to 30 MHz This mechanism becomes active as soon as the power at the input mixer exceeds the specified limit It ensures that the connection between RF input and input mixer is cut off When the overload prot...

Page 52: ...e data sheet Remote command INPut ip COUPling on page 140 Impedance The R S FSV A has an internal impedance of 50 Ω However some applications use other impedance values In order to match the impedance of an external application to the impedance of the R S FSV A an impedance matching pad can be inserted at the input If the type and impedance value of the used matching pad is known to the R S FSV A ...

Page 53: ...r frequencies close to zero Off The analog mixer path is always used Remote command INPut ip DPATh on page 140 YIG Preselector Activates or disables the YIG preselector if available on the R S FSV A An internal YIG preselector at the input of the R S FSV A ensures that image frequen cies are rejected However this is only possible for a restricted bandwidth To use the maximum bandwidth for signal a...

Page 54: ...s on an extract of the available data only Note Even when the file input is disabled the input file remains selected and can be enabled again quickly by changing the state Remote command INPut ip SELect on page 142 Select I Q data file Opens a file selection dialog box to select an input file that contains I Q data The I Q data must have a specific format iq tar as described in Chapter C I Q Data ...

Page 55: ...erial number of the probe Remote command SENSe PROBe pb ID SRNumber on page 144 Part Number Rohde Schwarz part number Remote command SENSe PROBe pb ID PARTnumber on page 143 Type Type of probe Single ended Differential Active Modular Remote command SENSe PROBe pb SETup TYPE on page 148 Mode Mode for multi mode modular probes Determines which voltage is measured DM mode Voltage between the positive...

Page 56: ...y 6 dB Remote command SENSe PROBe pb SETup ATTRatio on page 144 Microbutton Action Active Rohde Schwarz probes except for R S RT ZS10E have a configurable microbutton on the probe head By pressing this button you can perform an action on the instrument directly from the probe Select the action that you want to start from the probe Run Single Starts one data acquisition No Action Prevents unwanted ...

Page 57: ...thus defines the generator setup file to use For an overview of supported generators see Chapter 4 3 2 Overview of Supported Generators on page 27 For information on generator setup files see Chapter 4 3 3 Generator Setup Files on page 28 Remote command SYSTem COMMunicate RDEVice GENerator gen TYPE on page 154 Interface Type of interface connection used The following interfaces are currently suppo...

Page 58: ...MMunicate GPIB RDEVice GENerator gen ADDRess on page 153 SYSTem COMMunicate TCPip RDEVice GENerator gen ADDRess on page 155 Reference Selects the internal R S FSV A or an external frequency reference to synchronize the R S FSV A with the generator default internal Remote command SOURce si EXTernal gen ROSCillator SOURce on page 153 Edit Generator Setup File Displays the setup file for the currentl...

Page 59: ...rnal generator Remote command SOURce si EXTernal gen STATe on page 152 Source Power The output power of the external generator The default output power is 20 dBm The range is specified in the data sheet Remote command SOURce si EXTernal gen POWer LEVel on page 151 Source Offset Constant level offset for the external generator Values from 200 dB to 200 dB in 1 dB steps are allowed The default setti...

Page 60: ...nal gen FREQuency COUPling STATe on page 149 Manual Source Frequency Defines the fixed frequency to be used by the generator Remote command SOURce si EXTernal gen FREQuency on page 149 Automatic Source Frequency Numerator Denominator Offset With automatic frequency coupling a series of frequencies is defined one for each sweep point based on the current frequency at the RF input of the R S FSV A H...

Page 61: ...e start value defined for the R S FSV A Result Frequency Stop For reference only The stop frequency for the generator calculated from the config ured generator frequency and the stop value defined for the R S FSV A Source Calibration Functions The calibration functions of the external generator are available only if external genera tor control is active see Source State on page 59 Calibrate Transm...

Page 62: ...en circuit reflection type measurement to determine a reference trace for calibration If both reflection type calibrations open circuit short circuit are carried out the refer ence trace is calculated by averaging the two measurements The order of the two cali bration measurements is irrelevant Remote command SENSe CORRection METHod on page 156 Selects the reflection method SENSe CORRection COLLec...

Page 63: ...m is 100 the bottom is 0 By default the 0 dB line is displayed at the top of the diagram 100 This setting is only available if normalization is on see Source Calibration Normalize on page 62 The reference line defined by the reference value and reference position is similar to the Reference Level defined in the Amplitude settings However this reference line only affects the y axis scaling in the d...

Page 64: ...e supply voltage for an external noise source on or off in the firmware you can enable or disable the device as required External noise sources are useful when you are measuring power levels that fall below the noise floor of the R S FSV A itself for example when measuring the noise level of an amplifier In this case you can first connect an external noise source whose noise power level is known i...

Page 65: ...0 For background information on amplitude settings see the R S FSV A User Manual 5 4 1 Amplitude Settings Access Overview Amplitude Amplitude settings determine how the R S FSV A must process or display the expec ted input power levels Reference Level 66 Shifting the Display Offset 66 Unit 66 Setting the Reference Level Automatically Auto Level 67 RF Attenuation 67 Attenuation Mode Value 67 Using ...

Page 66: ... offset if the signal is attenuated or amplified before it is fed into the R S FSV A so the application shows correct power results All displayed power level results are shifted by this value The setting range is 200 dB in 0 01 dB steps Note however that the internal reference level used to adjust the hardware settings to the expected signal ignores any Reference Level Offset Thus it is important ...

Page 67: ...lt and when no optional electronic attenuation is available mechanical attenuation is applied This function is not available for input from the optional Digital Baseband Interface In Manual mode you can set the RF attenuation in 1 dB steps down to 0 dB Other entries are rounded to the next integer value The range is specified in the data sheet If the defined reference level cannot be set for the d...

Page 68: ...pedance are identical to those in the Input settings See Chapter 5 3 1 Input Source Settings on page 51 Preamplifier Input Settings If the optional internal preamplifier hardware is installed a preamplifier can be activa ted for the RF input signal You can use a preamplifier to analyze signals from DUTs with low output power For R S FSV A3004 3007 3013 and 3030 models the following settings are av...

Page 69: ...vel Position 69 Scaling 70 Y Axis Max 70 Range Defines the displayed y axis range in dB The default value is 100 dB Remote command DISPlay WINDow n TRACe t Y SCALe on page 179 Ref Level Position Defines the reference level position i e the position of the maximum AD converter value on the level axis in 0 corresponds to the lower and 100 to the upper limit of the diagram Remote command DISPlay WIND...

Page 70: ...B relative to the reference level only available for logarithmic units dB The upper line of the grid reference level is always at 0 dB Remote command DISPlay WINDow n SUBWindow w TRACe t Y SPACing on page 181 DISPlay WINDow n SUBWindow w TRACe t Y SCALe MODE on page 180 Y Axis Max Defines the maximum value of the y axis in the currently selected diagram in either direction in Volts Thus the y axis...

Page 71: ...p size for the center frequency Enter the step size in the Value field Remote command SENSe FREQuency CENTer STEP on page 182 Frequency Offset Shifts the displayed frequency range along the x axis by the defined offset This parameter has no effect on the instrument s hardware or on the captured data or on data processing It is simply a manipulation of the final results in which absolute fre quency...

Page 72: ...able for the I Q Ana lyzer however a special gating mode is available in remote control see Chap ter 8 4 4 3 Configuring I Q Gating on page 191 For step by step instructions on configuring triggered measurements see the R S FSV A User Manual Trigger Source 73 Trigger Source 73 Free Run 73 External Trigger 1 2 73 IF Power 73 I Q Power 74 Time 74 Trigger Level 74 Repetition Interval 74 Drop Out Time...

Page 73: ...tor meets or exceeds the specified trigger level See Trigger Level on page 74 Note The External Trigger 1 softkey automatically selects the trigger signal from the Trigger 1 Input Output connector on the front panel In the I Q Analyzer application only External Trigger 1 is supported For details see the Instrument Tour chapter in the R S FSV A Getting Started man ual External Trigger 1 Trigger sig...

Page 74: ...isition See Analysis Bandwidth on page 79 Remote command TRIG SOUR IQP see TRIGger SEQuence SOURce on page 187 Time Trigger Source Trigger Source Triggers in a specified repetition interval Remote command TRIG SOUR TIME see TRIGger SEQuence SOURce on page 187 Trigger Level Trigger Source Defines the trigger level for the specified trigger source For details on supported trigger levels see the data...

Page 75: ...that the trigger source must exceed before a trigger event occurs Setting a hysteresis avoids unwanted trigger events caused by noise oscillation around the trigger level This setting is only available for IF Power trigger sources The range of the value is between 3 dB and 50 dB with a step width of 1 dB Remote command TRIGger SEQuence IFPower HYSTeresis on page 185 Trigger Holdoff Trigger Source ...

Page 76: ... FSV A sends a trigger signal to the output connector to be used by connected devices Further trigger parameters are available for the connector Remote command OUTPut up TRIGger tp DIRection on page 188 Output Type Trigger 1 2 Type of signal to be sent to the output Trigger Off Deactivates the output Only for Trigger 3 for which only output is supported Device Trig gered Default Sends a trigger wh...

Page 77: ...r tp LEVel on page 189 Pulse Length Output Type Trigger 1 2 Defines the duration of the pulse pulse width sent as a trigger to the output connector Remote command OUTPut TRIGger tp PULSe LENGth on page 190 Send Trigger Output Type Trigger 1 2 Sends a user defined trigger to the output connector immediately Note that the trigger pulse level is always opposite to the constant signal level defined by...

Page 78: ... Figure 5 2 Data acquisition settings with advanced FFT parameters The remote commands required to perform these tasks are described in Chapter 8 4 5 Configuring Data Acquisition on page 193 Sample Rate 79 Analysis Bandwidth 79 Maximum Bandwidth 79 Meas Time 79 Record Length 79 Swap I Q 80 RBW 80 Advanced FFT mode Basic Settings 81 Transformation Algorithm 81 FFT Length 81 Window Function 81 Windo...

Page 79: ...ermined automatically For details on the maximum bandwidth see Chapter 4 1 1 Sample Rate and Maxi mum Usable I Q Bandwidth for RF Input on page 18 Auto Default All installed bandwidth extension options are enabled The currently available maximum bandwidth is allowed See Chapter 4 1 1 Sample Rate and Maximum Usable I Q Band width for RF Input on page 18 40 MHz Restricts the analysis bandwidth to a ...

Page 80: ...FFT Results RBW on page 42 Depending on the selected RBW mode the value is either determined automatically or can be defined manually As soon as you enter a value in the input field the RBW mode is changed to Manual If the Advanced Fourier Transformation Params option is enabled advanced FFT mode is selected and the RBW cannot be defined directly Note that the RBW is correlated with the Sample Rat...

Page 81: ...points determined by each FFT calculation The more points are used the higher the resolution in the spectrum becomes but the longer the calculation takes Note If you enter the value manually any integer value from 3 to 524288 is available Remote command SENSe IQ FFT LENGth on page 195 Window Function Advanced FFT mode Basic Settings In the I Q analyzer you can select one of several FFT window type...

Page 82: ...ace points that are evaluated and displayed in the result diagrams Note As opposed to previous versions of the I Q Analyzer the sweep settings are now window specific For some result displays the sweep points may not be editable as they are determined automatically or restrictions may apply For the I Q vector result display the number of I Q samples to record Record Length must be identical to the...

Page 83: ...ement is started Note Sequencer If the Sequencer is active the Continuous Sweep softkey only con trols the sweep mode for the currently selected channel However the sweep mode only takes effect the next time the Sequencer activates that channel and only for a channel defined sequence In this case a channel in continuous sweep mode is swept repeatedly If the Sequencer is active in MSRT mode the Con...

Page 84: ...t Frame Selects a specific frame loads the corresponding trace from the memory and displays it in the Spectrum window Note that activating a marker or changing the position of the active marker automati cally selects the frame that belongs to that marker This function is only available in single sweep mode or if the sweep is stopped and only if a spectrogram is selected The most recent frame is nu...

Page 85: ...arious evaluation methods All evaluation methods available for the current application are displayed in the evaluation bar in SmartGrid mode For a description of the available evaluation methods see Chapter 3 Measurement and Result Displays on page 13 Up to 6 evaluations can be displayed in the I Q Analyzer at any time including several graphical diagrams marker tables or peak lists The selected e...

Page 86: ... Measurement Time Meastime Auto 87 Changing the Automatic Measurement Time Meastime Manual 87 Upper Level Hysteresis 87 Lower Level Hysteresis 88 Adjusting all Determinable Settings Automatically Auto All Activates all automatic adjustment functions for the current measurement settings This includes Auto Frequency Auto Level Note Auto measurement For some measurements the Adjusting all Determinabl...

Page 87: ...esets the measurement duration for automatic settings to the default value Remote command SENSe ADJust CONFigure DURation MODE on page 201 Changing the Automatic Measurement Time Meastime Manual This function allows you to change the measurement duration for automatic setting adjustments Enter the value in seconds Note The maximum possible measurement duration depends on the currently selected mea...

Page 88: ...uators and the preamplifier are also adjusted To avoid frequent adapta tion due to small changes in the input signal you can define a hysteresis This setting defines a lower threshold the signal must fall below compared to the last measure ment before the reference level is adapted automatically Remote command SENSe ADJust CONFigure HYSTeresis LOWer on page 201 Adjusting Settings Automatically ...

Page 89: ...ired to perform these tasks are described in Chapter 6 Analysis on page 89 Trace Settings 89 Spectrogram Settings 93 Trace Data Export Configuration 97 Marker Usage 100 6 1 Trace Settings Access Overview Analysis Traces Or TRACE Trace Config You can configure the settings for up to 6 individual traces Trace data can also be exported to an ASCII file for further analysis For details see Chapter 6 3...

Page 90: ... is determined from several measurements and displayed The R S FSV A saves each trace point in the trace mem ory only if the new value is lower than the previous one Average The average is formed over several sweeps The Sweep Average Count determines the number of averaging pro cedures View The current contents of the trace memory are frozen and displayed Blank Removes the selected trace from the ...

Page 91: ...lue between 1 and 50 The smoothing value is defined as a percentage of the display width The larger the smoothing value the greater the smoothing effect For more information see the R S FSV A User Manual Remote command DISPlay WINDow n SUBWindow w TRACe t SMOothing STATe on page 220 DISPlay WINDow n SUBWindow w TRACe t SMOothing APERture on page 220 Average Mode Defines the mode with which the tra...

Page 92: ...y by selecting the appropriate button Function Trace Settings Preset All Traces Trace 1 Clear Write Traces 2 6 Blank Set Trace Mode Max Avg Min Trace 1 Max Hold Trace 2 Average Trace 3 Min Hold Traces 4 6 Blank Set Trace Mode Max ClrWrite Min Trace 1 Max Hold Trace 2 Clear Write Trace 3 Min Hold Traces 4 6 Blank Trace 1 Trace 2 Trace 3 Trace 4 Softkeys Displays the Traces settings and focuses the ...

Page 93: ...hey are handled during a sweep are provided as additional sweep settings for spectrogram display See Chapter 5 7 2 Sweep Settings on page 82 Search functions for spectrogram markers are described in Chapter 6 4 2 2 Marker Search Settings for Spectrograms on page 109 General Spectrogram Settings 93 Color Map Settings 96 6 2 1 General Spectrogram Settings Access TRACE Spectrogram Config This section...

Page 94: ...isplays it in the Spectrum window Note that activating a marker or changing the position of the active marker automati cally selects the frame that belongs to that marker This function is only available in single sweep mode or if the sweep is stopped and only if a spectrogram is selected The most recent frame is number 0 all previous frames have a negative number Remote command CALCulate n SPECtro...

Page 95: ...y con trols the sweep mode for the currently selected channel However the sweep mode only takes effect the next time the Sequencer activates that channel and only for a channel defined sequence In this case a channel in continuous sweep mode is swept repeatedly If the Sequencer is active in MSRT mode the Continuous Sweep function does not start data capturing It merely affects trace averaging over...

Page 96: ...and CALCulate n SPECtrogram CLEar IMMediate on page 224 6 2 2 Color Map Settings Access Overview Analysis Traces Spectrogram Color Mapping or TRACE Spectrogram Config Color Mapping In addition to the available color settings the dialog box displays the current color map and provides a preview of the display with the current settings Figure 6 1 Color Mapping dialog box 1 Color map shows the current...

Page 97: ...m result display 1 to 0 More colors are distributed among the lower values 0 Colors are distributed linearly among the values 0 to 1 More colors are distributed among the higher values Remote command DISPlay WINDow n SPECtrogram COLor SHAPe on page 229 Hot Cold Radar Grayscale Sets the color scheme for the spectrogram Remote command DISPlay WINDow n SPECtrogram COLor STYLe on page 230 Auto Defines...

Page 98: ...ttings 98 Trace to Export 99 Decimal Separator 99 Export Trace to ASCII File 99 File Type 100 Decimal Separator 100 Export Spectrogram to ASCII File 100 Export all Traces and all Table Results Selects all displayed traces and result tables e g Result Summary marker table etc in the current application for export to an ASCII file Alternatively you can select one specific trace only for export see T...

Page 99: ...lected Decimal Separator Defines the decimal separator for floating point numerals for the data export import files Evaluation programs require different separators in different languages Remote command FORMat DEXPort DSEParator on page 271 Export Trace to ASCII File Saves the selected trace or all traces in the currently active result display to the speci fied file and directory in the selected A...

Page 100: ...e 271 Decimal Separator Export Trace to ASCII File Defines the decimal separator for floating point numerals for the data export import files Evaluation programs require different separators in different languages Remote command FORMat DEXPort DSEParator on page 271 Export Spectrogram to ASCII File Opens a file selection dialog box and saves the selected spectrogram in ASCII format dat to the spec...

Page 101: ...w specific Marker Settings 101 Marker Search Settings and Positioning Functions 106 Marker Search Settings for Spectrograms 114 Marker Functions 117 6 4 1 Marker Settings Or MKR Marker Config The remote commands required to define these settings are described in Chap ter 8 7 3 1 Setting Up Individual Markers on page 230 Individual Marker Setup 101 General Marker Settings 104 6 4 1 1 Individual Mar...

Page 102: ...iagram Remote command CALCulate n MARKer m STATe on page 235 CALCulate n DELTamarker m STATe on page 233 Marker Position X value Defines the position x value of the marker in the diagram For normal markers the absolute position is indicated For delta markers the position relative to the reference marker is provided Remote command CALCulate n MARKer m X on page 235 CALCulate n DELTamarker m X on pa...

Page 103: ...is Linking is off by default Using this function you can set two markers on different traces to measure the differ ence e g between a max hold trace and a min hold trace or between a measurement and a reference trace Remote command CALCulate n MARKer ms LINK TO MARKer md on page 234 CALCulate n DELTamarker ms LINK TO MARKer md on page 231 CALCulate n DELTamarker m LINK on page 231 Assigning the Ma...

Page 104: ... m STATe on page 235 CALCulate n DELTamarker m STATe on page 233 All Marker Off Deactivates all markers in one step Remote command CALCulate n MARKer m AOFF on page 234 6 4 1 2 General Marker Settings Some general marker settings allow you to influence the marker behavior for all mark ers Marker Usage ...

Page 105: ...rker table is displayed If Marker Info is active the marker information is displayed within the diagram area Auto Default If more than two markers are active the marker table is dis played automatically If Marker Info is active the marker information for up to two markers is displayed in the diagram area Remote command DISPlay WINDow n MTABle on page 236 Marker Info Turns the marker information di...

Page 106: ...c position very quickly and easily or to use the current marker position to define another characteristic value In order to determine the required marker position searches may be performed The search results can be influenced by special settings For more information on searching for signal peaks see Chapter 6 4 4 2 Marker Peak List on page 120 In I Q Analyzer mode the search settings for Real Imag...

Page 107: ...o either side of the current peak Right Determines the next maximum minimum to the right of the current peak Remote command Chapter 8 7 3 5 Positioning the Marker on page 251 Exclude LO If activated restricts the frequency range for the marker search functions On The minimum frequency included in the peak search range is 5 resolution bandwidth RBW Due to the interference by the first local oscilla...

Page 108: ...ate n MARKer m MINimum AUTO on page 253 Search Limits The search results can be restricted by limiting the search area or adding search con ditions Search Limits Left Right Search Limits If activated limit lines are defined and displayed for the search Only results within the limited search range are considered Remote command CALCulate n MARKer m X SLIMits STATe on page 239 CALCulate n MARKer m X ...

Page 109: ...ormed on the real trace of the I Q measurement Imag Marker search functions are performed on the imaginary trace of the I Q measurement Magnitude Marker search functions are performed on the magnitude of the I and Q data Remote command CALCulate n MARKer m SEARch on page 238 6 4 2 2 Marker Search Settings for Spectrograms Access Overview Analysis Markers Search or MKR TO Search Config Spectrograms...

Page 110: ...earch mode for the next peak search within the currently selected frame Left Determines the next maximum minimum to the left of the current peak Absolute Determines the next maximum minimum to either side of the current peak Right Determines the next maximum minimum to the right of the current peak Remote command Chapter 8 7 3 5 Positioning the Marker on page 251 Search Mode for Next Peak in Y Dir...

Page 111: ...imum NEXT on page 245 CALCulate n DELTamarker m SPECtrogram Y MINimum NEXT on page 250 Marker Search Type Defines the type of search to be performed in the spectrogram X Search Searches only within the currently selected frame Y Search Searches within all frames but only at the current frequency position XY Search Searches in all frames at all positions Remote command Defined by the search functio...

Page 112: ...or the peak search Only peaks that exceed the threshold are detected Remote command CALCulate n THReshold on page 241 Use Zoom Limits Search Limits If activated the peak search is restricted to the active zoom area defined for a single zoom Remote command CALCulate n MARKer m X SLIMits ZOOM STATe on page 240 Deactivating All Search Limits Search Limits Deactivates the search range limits Remote co...

Page 113: ... is active marker 1 is activated Remote command CALCulate n MARKer m MINimum PEAK on page 254 CALCulate n DELTamarker m MINimum PEAK on page 256 Search Next Minimum Sets the selected marker delta marker to the next higher minimum of the selected trace If no marker is active marker 1 is activated For spectrogram displays define which frame the next minimum is to be searched in Remote command CALCul...

Page 114: ...e frame x direction and within several time frames y direction These settings are only available for spectrogram displays Search Mode for Next Peak in X Direction 114 Search Mode for Next Peak in Y Direction 115 Marker Search Type 115 Marker Search Area 115 Peak Excursion 116 Search Limits 116 Search Limits Left Right 116 Search Threshold 116 Use Zoom Limits 116 Deactivating All Search Limits 116 ...

Page 115: ... page 244 CALCulate n DELTamarker m SPECtrogram Y MAXimum BELow on page 249 CALCulate n MARKer m SPECtrogram Y MAXimum NEXT on page 244 CALCulate n DELTamarker m SPECtrogram Y MAXimum NEXT on page 249 CALCulate n MARKer m SPECtrogram Y MINimum ABOVe on page 245 CALCulate n DELTamarker m SPECtrogram Y MINimum ABOVe on page 249 CALCulate n MARKer m SPECtrogram Y MINimum BELow on page 245 CALCulate n...

Page 116: ...r adding search con ditions Search Limits Left Right Search Limits If activated limit lines are defined and displayed for the search Only results within the limited search range are considered Remote command CALCulate n MARKer m X SLIMits STATe on page 239 CALCulate n MARKer m X SLIMits LEFT on page 239 CALCulate n MARKer m X SLIMits RIGHt on page 240 Search Threshold Search Limits Defines an abso...

Page 117: ...o be calculated as reference power values in dB For analog demodulation measurements relative band power markers are not availa ble In this case the result of the band power deltamarker is the difference between the absolute power in the band around the delta marker and the absolute power for the ref erence marker The powers are subtracted logarithmically so the result is a dB value Relative band ...

Page 118: ...ker is used as a band power marker all other marker functions for this marker are deactivated If the detector mode for the marker trace is set to Auto the RMS detector is used The individual marker settings correspond to those defined in the Marker dialog box see Chapter 6 4 1 1 Individual Marker Setup on page 101 Any settings to the marker state or type changed in the Marker Function dialog box a...

Page 119: ...red The span is indicated by lines in the diagram Remote command CALCulate n MARKer m FUNCtion BPOWer SPAN on page 258 CALCulate n DELTamarker m FUNCtion BPOWer SPAN on page 260 Power Mode Defines the mode of the power measurement result For analog demodulation measurements the power mode is not editable for AM FM or PM spectrum results In this case the marker function does not determine a power v...

Page 120: ...eak List Updating the marker position to the current peak value automatically after each sweep Auto Peak Search Creating a fixed reference marker at the current peak value of a trace Fixed Refer ence Peak search limits The peak search can be restricted to a search area The search area is defined by limit lines which are also indicated in the diagram In addition a minimum value threshold can be def...

Page 121: ...rise at least 60 dB before falling again before a peak is detected Marker peak list The marker peak list determines the frequencies and levels of peaks in the spectrum It is updated automatically after each sweep How many peaks are displayed can be defined as well as the sort order In addition the detected peaks can be indicated in the diagram The peak list can also be exported to a file for analy...

Page 122: ...cy level In this case the maximum level can be determined by an initial peak search and then be used as a reference point for further measurement results Remote commands CALCulate n MARKer m FUNCtion FPEaks STATe on page 263 TRAC LIST see TRACe n DATA on page 269 Peak List State 122 Sort Mode 123 Maximum Number of Peaks 123 Peak Excursion 123 Display Marker Numbers 123 Export Peak List 123 Peak Li...

Page 123: ... from 0 dB to 80 dB are allowed the resolution is 0 1 dB The default setting for the peak excursion is 6 dB For analog demodulation the unit and value range depend on the selected result dis play type Remote command CALCulate n MARKer m PEXCursion on page 238 Display Marker Numbers By default the marker numbers are indicated in the diagram so you can find the peaks from the list However for large ...

Page 124: ...Analysis R S FSV A3000 I Q Analyzer 124 User Manual 1178 8536 02 01 Remote command Marker Usage ...

Page 125: ... Q Analyzer application 2 Select the Overview softkey to display the Overview for an I Q Analyzer mea surement 3 Select the Display Config button and select up to six displays that are of interest to you Arrange them on the display to suit your preferences 4 Exit the SmartGrid mode and select the Overview softkey to display the Over view again 5 Select the Analysis button in the Overview to make u...

Page 126: ...ion 2 If necessary switch to single sweep mode by pressing the RUN SINGLE key 3 Select the Input Frontend button and switch to the Input Source I Q File tab 4 Select Select File 5 In the file selection dialog box select the file that contains the exported I Q data iq tar extension 6 Set the I Q file state to On 7 Select the Frequency tab to define the input signal s center frequency 8 Start a new ...

Page 127: ...How to Work with I Q Data R S FSV A3000 I Q Analyzer 127 User Manual 1178 8536 02 01 4 Drag the I Q parameter XML file e g example xml into your web browser How to Export and Import I Q Data ...

Page 128: ...ng the SCPI Recorder functions you can create a SCPI script directly on the instru ment and then export the script for use on the controller You can also edit or write a script manually using a suitable editor on the controller For manual creation the instrument supports you by showing the corresponding command syntax for the cur rent setting value For details see the Network and Remote Operation ...

Page 129: ...tions used in Descriptions Note the following conventions used in the remote command descriptions Command usage If not specified otherwise commands can be used both for setting and for querying parameters If a command can be used for setting or querying only or if it initiates an event the usage is stated explicitly Parameter usage If not specified otherwise a parameter can be used to set a value ...

Page 130: ...s have a numeric suffix if the command can be applied to multiple instances of an object In that case the suffix selects a particular instance e g a mea surement window Numeric suffixes are indicated by angular brackets n next to the keyword If you don t quote a suffix for keywords that support one a 1 is assumed Example DISPlay WINDow 1 4 ZOOM STATe enables the zoom in a particular mea surement w...

Page 131: ...IDth RESolution In the short form without optional keywords BAND 1MHZ would have the same effect as BWID 1MHZ 8 1 6 SCPI Parameters Many commands feature one or more parameters If a command supports more than one parameter these are separated by a comma Example LAYout ADD WINDow Spectrum LEFT MTABle Parameters may have different forms of values Numeric Values 131 Boolean 132 Character Data 133 Cha...

Page 132: ...rns a number In case of physical quantities it applies the basic unit e g Hz in case of frequencies The number of dig its after the decimal point depends on the type of numeric value Example Setting SENSe FREQuency CENTer 1GHZ Query SENSe FREQuency CENTer would return 1E9 In some cases numeric values may be returned as text INF NINF Infinity or negative infinity Represents the numeric values 9 9E3...

Page 133: ...of large amounts of data The ASCII character introduces the data block The next number indicates how many of the following digits describe the length of the data block In the example the 4 follow ing digits indicate the length to be 5168 bytes The data bytes follow During the trans mission of these data bytes all end or other control signs are ignored until all bytes are transmitted 0 specifies a ...

Page 134: ...fferent remote modes available In remote control two different modes for the I Q Analyzer measurements are availa ble A quick mode for pure data acquisition This mode is activated by default with the TRACe IQ STATe command The evaluation functions are not available however performance is slightly improved A more sophisticated mode for acquisition and analysis This mode is activated when a new chan...

Page 135: ... For a list of available channel types see INSTrument LIST on page 136 ChannelName String containing the name of the channel Note that you can not assign an existing channel name to a new channel this will cause an error Example INST CRE SAN Spectrum 2 Adds an additional spectrum display named Spectrum 2 INSTrument CREate REPLace ChannelName1 ChannelType ChannelName2 This command replaces a channe...

Page 136: ...lType ChannelName For each channel the command returns the channel type and channel name see tables below Tip to change the channel name use the INSTrument REName command Example INST LIST Result for 3 channels ADEM Analog Demod IQ IQ Analyzer IQ IQ Analyzer2 Usage Query only Table 8 2 Available channel types and default channel names Application ChannelType Parameter Default Channel Name Spectrum...

Page 137: ...ontaining the name of the channel you want to rename ChannelName2 String containing the new channel name Note that you cannot assign an existing channel name to a new channel this will cause an error Channel names can have a maximum of 31 characters and must be compatible with the Windows conventions for file names In particular they must not contain special characters such as Example INST REN IQA...

Page 138: ...a analysis on and off Before you can use this command you have to turn on the I Q data acquisition using INST CRE NEW IQ or INST CRE REPL or using the TRACe IQ STATe com mand to replace the current channel while retaining the settings Parameters State ON OFF 0 1 OFF 0 Switches the function off ON 1 Switches the function on Example TRAC IQ ON Enables I Q data acquisition TRAC IQ EVAL ON Enables the...

Page 139: ...urements Configuring the Data Input and Output 139 Configuring the Vertical Axis Amplitude Scaling 172 Frequency 181 Triggering 183 Configuring Data Acquisition 193 Adjusting Settings Automatically 200 8 4 1 Configuring the Data Input and Output The following commands are required to configure data input and output RF Input 139 Input from I Q Data Files 142 Setting up Probes 143 External Generator...

Page 140: ...or details on the protection mechanism see RF Input Protection on page 51 Suffix ip 1 2 irrelevant Example INP ATT PROT RES INPut ip COUPling CouplingType This command selects the coupling type of the RF input The command is not available for measurements with the optional Digital Baseband Interface Suffix ip 1 2 irrelevant Parameters CouplingType AC DC AC AC coupling DC DC coupling RST AC Example...

Page 141: ...t ip IMPedance Impedance This command selects the nominal input impedance of the RF input In some applica tions only 50 Ω are supported The command is not available for measurements with the optional Digital Baseband Interface Suffix ip 1 2 irrelevant Parameters Impedance 50 75 numeric value User defined impedance from 50 Ohm to 100000000 Ohm 100 MOhm User defined values are only available for the...

Page 142: ... input or file input is supported Suffix ip 1 n Parameters Source RF Radio Frequency RF INPUT connector FIQ I Q data file selected by INPut ip FILE PATH on page 143 RST RF Manual operation See Radio Frequency State on page 52 See I Q Input File State on page 54 8 4 1 2 Input from I Q Data Files The input for measurements can be provided from I Q data files The commands required to configure the us...

Page 143: ...HZ Example INP FILE PATH C R_S Instr user data iq tar Uses I Q data from the specified file as input Manual operation See Select I Q data file on page 54 8 4 1 3 Setting up Probes Modular probes can be connected to the RF input connector of the R S FSV A For details see Chapter 4 2 Using Probes on page 21 SENSe PROBe pb ID PARTnumber 143 SENSe PROBe pb ID SRNumber 144 SENSe PROBe pb SETup ATTRatio...

Page 144: ...nuation applied to the input at the probe This setting is only available for modular probes Suffix pb 1 n Selects the connector 3 RF Parameters AttenuationRatio 10 Attenuation by 20 dB ratio 10 1 2 Attenuation by 6 dB ratio 2 1 RST 10 Default unit DB Manual operation See Attenuation on page 56 SENSe PROBe pb SETup CMOFfset CMOffset Sets the common mode offset The setting is only available if a dif...

Page 145: ...probe is reset to 0 0 V Note that if the offset for DM mode or CM mode is changed the offsets for the P mode and N mode are adapted accordingly and vice versa For details see Chapter 4 2 1 1 MultiMode Function and Offset Compensation for Modular RF Probes on page 23 Suffix pb 1 n Selects the connector 3 RF Parameters DMOffset Voltage offset between the positive and negative input terminal Default ...

Page 146: ...erminals is 16 V If the probe is disconnected the N mode offset of the probe is reset to 0 0 V Note that if the offset for DM mode or CM mode is changed the offsets for the P mode and N mode are adapted accordingly and vice versa For details see Chapter 4 2 1 1 MultiMode Function and Offset Compensation for Modular RF Probes on page 23 Suffix pb 1 n Selects the connector 3 RF Parameters NMOffset T...

Page 147: ... in P mode is connected to the R S FSV A The maximum voltage difference between the positive and negative input terminals is 16 V If the probe is disconnected the P mode offset of the probe is reset to 0 0 V Note that if the offset for DM mode or CM mode is changed the offsets for the P mode and N mode are adapted accordingly and vice versa For details see Chapter 4 2 1 1 MultiMode Function and Of...

Page 148: ...Example Query probe type PROB3 SET TYPE Usage Query only Manual operation See Type on page 55 8 4 1 4 External Generator Control External generator control commands are available if the R S FSV A External Genera tor Control option R S FSV3 B10 is installed For each measurement channel one external generator can be configured To switch between different configurations define multiple measurement ch...

Page 149: ... command defines a fixed source frequency for the external generator Suffix si irrelevant gen Parameters Frequency Source frequency of the external generator RST 1100050000 Default unit HZ Example Define frequency of the generator SOUR EXT FREQ 10MHz Manual operation See Manual Source Frequency on page 60 SOURce si EXTernal gen FREQuency COUPling STATe State This command couples the frequency of t...

Page 150: ...o Numerator F F min Suffix si irrelevant gen Parameters Value numeric value RST 1 Example Define multiplication factor of 4 3 the transmit frequency of the generator is 4 3 times the analyzer frequency SOUR EXT FREQ NUM 4 SOUR EXT FREQ DEN 3 Manual operation See Automatic Source Frequency Numerator Denominator Offset on page 60 SOURce si EXTernal gen FREQuency FACTor NUMerator Value This command d...

Page 151: ...t such that the frequency range of the generator is not exceeded if the following formula is applied to the start and stop frequency of the analyzer Offset Analyzer Generator F ator Deno Numerator F F min Suffix si irrelevant gen Parameters Offset numeric value specified in Hz kHz MHz or GHz rounded to the nearest Hz RST 0 Hz Default unit HZ Example Define an offset between generator output freque...

Page 152: ...am ple attenuators or amplifiers at the output of the external generator can be taken into account for the setting Suffix si irrelevant Parameters Offset Range 200 dB to 200 dB RST 0dB Default unit DB Example Define a level offset on the external generator SOUR POW OFFS 10dB Manual operation See Source Offset on page 59 Interface Configuration The following commands are required to configure the i...

Page 153: ... RST INT Example Select an external reference oscillator SOUR EXT ROSC EXT Manual operation See Reference on page 58 SYSTem COMMunicate GPIB RDEVice GENerator gen ADDRess Number Changes the IEC IEEE bus address of the external generator Suffix gen 1 n Parameters Number Range 0 to 30 RST 28 Example SYST COMM GPIB RDEV GEN ADDR 15 Manual operation See GPIB Address TCPIP Address Computer Name on page...

Page 154: ...enerator control is active see SOURce si EXTernal gen STATe on page 152 Suffix gen Parameters Type GPIB TTL GPIB GPIB connection without TTL synchronization for all generators of other manufacturers and some Rohde Schwarz devices TTL GPIB connection with TTL synchronization if available for most Rohde Schwarz devices RST GPIB Example SYST COMM RDEV GEN LINK TTL Selects GPIB TTL interface for gener...

Page 155: ... described elsewhere DISPlay WINDow n TRACe t Y SCALe RPOSition on page 180 Remote commands exclusive to source calibration DISPlay WINDow n SUBWindow w TRACe t Y SCALe RVALue 155 SENSe CORRection COLLect ACQuire 156 SENSe CORRection METHod 156 SENSe CORRection RECall 157 SENSe CORRection STATe 157 SENSe CORRection TRANsducer GENerate 157 DISPlay WINDow n SUBWindow w TRACe t Y SCALe RVALue Value T...

Page 156: ...ion mode calibration with direct connection between external generator and device input REFLection mode calibration with short circuit at the input OPEN only allowed in REFLection mode calibration with open input Example INIT CONT OFF Selects single sweep operation CORR METH TRAN Selects a transmission measurement CORR COLL THR WAI Starts the measurement of reference data using direct connec tion ...

Page 157: ...ameters State ON OFF 0 1 OFF 0 Switches the function off ON 1 Switches the function on Example CORR ON Activates normalization Manual operation See Source Calibration Normalize on page 62 SENSe CORRection TRANsducer GENerate Name This command uses the normalized measurement data to generate a transducer factor with up to 1001 points The trace data is converted to a transducer with unit dB and stor...

Page 158: ...8 SYST COMM RDEV GEN INT GPIB SYST COMM GPIB RDEV GEN ADDR 28 Activate the use of TTL synchronization to optimize measurement speed SYST COMM RDEV GEN LINK TTL Activate the use of the external reference frequency at 10 MHz on the generator SOUR EXT ROSC EXT Configuring the calibration measurement Activate external generator control SOUR EXT STAT ON Set the generator output level to 10 dBm SOUR EXT...

Page 159: ...ion trace results Retrieve the normalized power levels power offsets from calibration results Should be 0 for all sweep points directly after calibration SENS CORR STAT ON TRAC DATA TRACE1 Changing the display of the calibration results Shift the reference line so the 5 dB level is displayed in the center DISP TRAC Y SCAL RVAL 5DB DISP TRAC Y SCAL RPOS 50PCT 8 4 1 5 Working with Power Sensors The ...

Page 160: ... sensor index Return values NumberSensors Number of connected power sensors Example SYST COMM RDEV PMET COUN Usage Query only SYSTem COMMunicate RDEVice PMETer p DEFine Placeholder Type Interface SerialNo This command assigns the power sensor with the specified serial number to the selected power sensor index configuration The query returns the power sensor type and serial number of the sensor ass...

Page 161: ...e STATe 163 SENSe PMETer p DCYCle VALue 163 SENSe PMETer p FREQuency 163 SENSe PMETer p FREQuency LINK 164 SENSe PMETer p MTIMe 164 SENSe PMETer p MTIMe AVERage COUNt 164 SENSe PMETer p MTIMe AVERage STATe 165 SENSe PMETer p ROFFset STATe 165 SENSe PMETer p STATe 166 SENSe PMETer p UPDate STATe 166 UNIT n PMETer p POWer 166 UNIT n PMETer p POWer RATio 166 CALibration PMETer p ZERO AUTO ONCE This c...

Page 162: ...lative measurements Suffix n Window p Power sensor index Example CALC PMET2 REL AUTO ONCE Takes the current measurement value as reference value for rel ative measurements for power sensor 2 Usage Event CALCulate n PMETer p RELative STATe State This command turns relative power sensor measurements on and off Suffix n Window p Power sensor index Parameters State ON OFF 0 1 OFF 0 Switches the functi...

Page 163: ...FF 0 Switches the function off ON 1 Switches the function on Example PMET2 DCYC STAT ON SENSe PMETer p DCYCle VALue Percentage This command defines the duty cycle for the correction of pulse signals The power sensor uses the duty cycle in combination with the mean power to calculate the power of the pulse Suffix p Power sensor Parameters Percentage Range 0 001 to 99 999 RST 99 999 Default unit Exa...

Page 164: ...e center frequency of the analyzer MARKer1 Couples the frequency to the position of marker 1 OFF Switches the frequency coupling off RST CENTer Example PMET2 FREQ LINK CENT Couples the frequency to the center frequency of the analyzer SENSe PMETer p MTIMe Duration This command selects the duration of power sensor measurements Suffix p Power sensor index Parameters Duration SHORt NORMal LONG RST NO...

Page 165: ...TIM AVER COUN 8 Sets the number of readings to 8 SENSe PMETer p MTIMe AVERage STATe State This command turns averaging for power sensor measurements on and off Suffix p Power sensor index Parameters State ON OFF 0 1 OFF 0 Switches the function off ON 1 Switches the function on Example PMET2 MTIM AVER ON Activates manual averaging SENSe PMETer p ROFFset STATe State This command includes or excludes...

Page 166: ... of power sensor measurements on and off If on the results are update even if a single sweep is complete Suffix p Power sensor index Parameters State ON OFF 0 1 OFF 0 Switches the function off ON 1 Switches the function on Example PMET1 UPD ON The data from power sensor 1 is updated continuously UNIT n PMETer p POWer Unit This command selects the unit for absolute power sensor measurements Suffix ...

Page 167: ...nes the time period that the input signal has to stay below the IF power trigger level before the measurement starts Suffix p Power sensor index Parameters Time Range 0 s to 1 s Increment 100 ns RST 100 µs Default unit S Example PMET2 TRIG DTIMe 0 001 SENSe PMETer p TRIGger HOLDoff Holdoff This command defines the trigger holdoff for external power triggers Suffix p Power sensor index Parameters H...

Page 168: ...T 10 Sets the hysteresis of the trigger to 10 dB SENSe PMETer p TRIGger LEVel Level This command defines the trigger level for external power triggers Suffix p Power sensor index Parameters Level 20 to 20 dBm Range 20 dBm to 20 dBm RST 10 dBm Default unit DBM Example PMET2 TRIG LEV 10 dBm Sets the level of the trigger SENSe PMETer p TRIGger SLOPe Edge This command selects the trigger condition for...

Page 169: ...er input output is described in Chapter 8 4 4 2 Configuring the Trig ger Output on page 188 DIAGnostic SERVice NSOurce 169 OUTPut up IF IFFRequency 170 OUTPut up IF STATe 170 OUTPut up UPORt STATe 170 OUTPut up UPORt VALue 171 OUTPut up VIDeo STATe 171 SYSTem SPEaker STATe 171 SYSTem SPEaker MAXVolume 172 SYSTem SPEaker MUTE 172 SYSTem SPEaker VOLume 172 DIAGnostic SERVice NSOurce State This comma...

Page 170: ...he measured IF value at the IF output connector Suffix up 1 n Parameters State ON OFF 0 1 OFF 0 Switches the function off ON 1 Switches the function on RST 0 Example OUTP IF STAT ON OUTPut up UPORt STATe State This command toggles the control lines of the user ports for the AUX PORT connector This 9 pole SUB D male connector is located on the rear panel of the R S FSV A For the R S FSV A this comm...

Page 171: ... type voltage levels max 5V Range B00000000 to B00111111 Example OUTP UPOR B00100100 Sets pins 5 and 7 to 5 V OUTPut up VIDeo STATe State Enables or disables output of the displayed video signal i e the filtered and detected IF signal at the Video output connector Suffix up 1 n Parameters State ON OFF 0 1 OFF 0 Switches the function off ON 1 Switches the function on RST 0 Example OUTP VID STAT ON ...

Page 172: ... 50 SYSTem SPEaker MUTE Temporarily disables the audio output via the built in loudspeakers Example SYST SPE MUTE SYSTem SPEaker VOLume Volume This command defines the volume of the built in loudspeaker for demodulated signals This setting is maintained for all applications The command is available in the time domain in Spectrum mode and in Analog Demodulation mode Parameters Volume Percentage of ...

Page 173: ... Y SCALe RLEVel OFFSet 174 CALCulate n MARKer m FUNCtion REFerence This command matches the reference level to the power level of a marker If you use the command in combination with a delta marker that delta marker is turned into a normal marker Suffix n Window m Marker Example CALC MARK2 FUNC REF Sets the reference level to the level of marker 2 Manual operation See Reference Level Marker Level o...

Page 174: ...n TRACe t Y SCALe RLEVel OFFSet Offset This command defines a reference level offset for all traces in all windows Suffix n irrelevant t irrelevant Parameters Offset Range 200 dB to 200 dB RST 0dB Default unit DB Example DISP TRAC Y RLEV OFFS 10dB Manual operation See Shifting the Display Offset on page 66 8 4 2 2 Configuring the Attenuation INPut ip ATTenuation 174 INPut ip ATTenuation AUTO 175 I...

Page 175: ... operation See Attenuation Mode Value on page 67 INPut ip ATTenuation AUTO State This command couples or decouples the attenuation to the reference level Thus when the reference level is changed the R S FSV A determines the signal level for optimal internal data processing and sets the required attenuation accordingly This function is not available if the optional Digital Baseband Interface is act...

Page 176: ...e option It is not available if the optional Digital Baseband Interface is active Suffix ip 1 2 irrelevant Parameters Attenuation attenuation in dB Range see data sheet Increment 1 dB RST 0 dB OFF Default unit DB Example INP EATT AUTO OFF INP EATT 10 dB Manual operation See Using Electronic Attenuation on page 67 INPut ip EATT AUTO State This command turns automatic selection of the electronic att...

Page 177: ...nal path Manual operation See Using Electronic Attenuation on page 67 8 4 2 3 Configuring a Preamplifier INPut ip EGAin STATe 177 INPut ip GAIN STATe 178 INPut ip GAIN VALue 178 INPut ip EGAin STATe State Before this command can be used the external preamplifier must be connected to the R S FSV A See the preamplifier s documentation for details When activated the R S FSV A automatically compensate...

Page 178: ... Suffix ip 1 2 irrelevant Parameters State ON OFF 0 1 OFF 0 Switches the function off ON 1 Switches the function on RST 0 Example INP GAIN STAT ON INP GAIN VAL 15 Switches on 15 dB preamplification Manual operation See Preamplifier on page 68 INPut ip GAIN VALue Gain This command selects the gain if the preamplifier is activated INP GAIN STAT ON see INPut ip GAIN STATe on page 178 The command requ...

Page 179: ...NDow n TRACe t Y SCALe PDIVision 180 DISPlay WINDow n TRACe t Y SCALe RPOSition 180 DISPlay WINDow n SUBWindow w TRACe t Y SPACing 181 DISPlay WINDow n TRACe t Y SCALe Range This command defines the display range of the y axis for all traces Note that the command works only for a logarithmic scaling You can select the scaling with DISPlay WINDow n SUBWindow w TRACe t Y SPACing Suffix n Window t ir...

Page 180: ...command determines the grid spacing on the Y axis for all diagrams where possible In spectrum displays for example this command is not available Suffix n Window t irrelevant Parameters Value numeric value WITHOUT UNIT unit according to the result dis play Defines the range per division total range 10 Value RST depends on the result display Default unit DBM Example DISP TRAC Y PDIV 10 Sets the grid...

Page 181: ...ay WINDow n SUBWindow w TRACe t Y SPACing ScalingType This command selects the scaling of the y axis for all traces t is irrelevant Suffix n Window w subwindow t Trace Parameters ScalingType LOGarithmic Logarithmic scaling LINear Linear scaling in LDB Linear scaling in the specified unit PERCent Linear scaling in RST LOGarithmic Example DISP TRAC Y SPAC LIN Selects linear scaling in Manual operati...

Page 182: ... Frequency The allowed range and fmax is specified in the data sheet RST fmax 2 Default unit Hz Example FREQ CENT 100 MHz FREQ CENT STEP 10 MHz FREQ CENT UP Sets the center frequency to 110 MHz Manual operation See Center Frequency on page 71 SENSe FREQuency CENTer STEP StepSize This command defines the center frequency step size You can increase or decrease the center frequency quickly in fixed s...

Page 183: ...r this shift numerically by the application See also Frequency Offset on page 71 Parameters Offset Range 100 GHz to 100 GHz RST 0 Hz Default unit HZ Example FREQ OFFS 1GHZ Manual operation See Frequency Offset on page 71 8 4 4 Triggering The following remote commands are required to configure a triggered measurement in a remote environment More details are described for manual operation in Chapter...

Page 184: ... the default drop out time is set to 100 ns to avoid unintentional trigger events as no hysteresis can be configured in this case Parameters DropoutTime Dropout time of the trigger Range 0 s to 10 0 s RST 0 s Default unit S Manual operation See Drop Out Time on page 74 TRIGger SEQuence HOLDoff TIME Offset Defines the time offset between the trigger event and the start of the sweep Parameters Offse...

Page 185: ...wer trig ger sources Parameters Hysteresis Range 3 dB to 50 dB RST 3 dB Default unit DB Example TRIG SOUR IFP Sets the IF power trigger source TRIG IFP HYST 10DB Sets the hysteresis limit value Manual operation See Hysteresis on page 75 TRIGger tp SEQuence LEVel EXTernal port TriggerLevel This command defines the level the external signal must exceed to cause a trigger event In the I Q Analyzer ap...

Page 186: ...rface R S FSV A B71 Parameters TriggerLevel For details on available trigger levels and trigger bandwidths see the data sheet RST 10 dBm Default unit DBM Example TRIG LEV IFP 30DBM Manual operation See Trigger Level on page 74 TRIGger SEQuence LEVel IQPower TriggerLevel This command defines the magnitude the I Q data must exceed to cause a trigger event Note that any RF attenuation or preamplifica...

Page 187: ...on is avoided in your remote control programs Parameters Source IMMediate Free Run EXTernal Trigger signal from the Trigger Input connector Trigger signal from the Trigger In connector If power splitter mode is active this parameter activates the EXT TRIGGER INPUT connector on the oscilloscope Then the R S FSV A triggers when the signal fed into the EXT TRIG GER INPUT connector on the oscilloscope...

Page 188: ... command defines the repetition interval for the time trigger Parameters Interval 2 0 ms to 5000 Range 2 ms to 5000 s RST 1 0 s Default unit S Example TRIG SOUR TIME Selects the time trigger input for triggering TRIG TIME RINT 50 The sweep starts every 50 s Manual operation See Repetition Interval on page 74 8 4 4 2 Configuring the Trigger Output The following commands are required to send the tri...

Page 189: ...L compatible signal generated at the trigger output This command works only if you have selected a user defined output with OUTPut up TRIGger tp OTYPe Suffix up 1 n tp Selects the trigger port to which the output is sent 2 trigger port 2 front 3 trigger port 3 rear 2 Trigger 2 Input Output Parameters Level HIGH 5 V LOW 0 V RST LOW Example OUTP TRIG2 LEV HIGH Manual operation See Level on page 77 O...

Page 190: ...Manual operation See Output Type on page 76 OUTPut TRIGger tp PULSe IMMediate This command generates a pulse at the trigger output Suffix tp Selects the trigger port to which the output is sent 2 trigger port 2 front 3 trigger port 3 rear 2 Trigger 2 Input Output Usage Event Manual operation See Send Trigger on page 77 OUTPut TRIGger tp PULSe LENGth Length This command defines the length of the pu...

Page 191: ...ethods Edge triggered capturing After a trigger signal the gate period is defined by a gate length and a gate dis tance All data in the gate period is captured until the required number of samples has been captured Level triggered capturing After a trigger signal all data is captured in which the gate signal is set to 1 which means it has exceeded a level In this case the gate signal can be genera...

Page 192: ...yzer Parameters GateLength numeric value Max 440 MS sample rate 200MHz 1 pretrigger samples defined by TRACe IQ SET sample rate defined by TRACe IQ SRATe Range 1 Max samples RST 100 Example TRAC IQ EGAT LENG 2000 TRACe IQ EGATe NOF Number This command defines the number of gate periods after the trigger signal for gated measurements with the I Q analyzer Parameters Number Range 1 to 1023 RST 1 Exa...

Page 193: ...ENGth 195 SENSe IQ FFT WINDow LENGth 195 SENSe IQ FFT WINDow OVERlap 195 SENSe IQ FFT WINDow TYPE 195 SENSe SWAPiq 196 TRACe IQ BWIDth 196 TRACe IQ RLENgth 196 TRACe IQ SET 197 TRACe IQ SRATe 198 TRACe IQ TPISample 198 TRACe IQ WBANd STATe 199 TRACe IQ WBANd MBWidth 199 SENSe IQ BANDwidth MODE Mode SENSe IQ BWIDth MODE Mode This command defines how the resolution bandwidth is determined Parameters...

Page 194: ...HZ Example IQ BAND MODE MAN Switches to manual RBW mode IQ BAND RES 120000 Sets the RBW to 120 kHz Manual operation See RBW on page 80 SENSe IQ FFT ALGorithm Method Defines the FFT calculation method Parameters Method SINGle One FFT is calculated for the entire record length if the FFT length is larger than the record length see SENSe IQ FFT LENGth and TRACe IQ RLENgth zeros are appended to the ca...

Page 195: ... be included in a single FFT window when multiple FFT windows are used Parameters NoOfFFT integer value Range 3 to 1001 RST 1001 Example IQ FFT WIND LENG 500 Manual operation See Window Length on page 81 SENSe IQ FFT WINDow OVERlap Rate Defines the part of a single FFT window that is re calculated by the next FFT calcula tion Parameters Rate double value Percentage rate Range 0 to 1 RST 0 75 Examp...

Page 196: ...to compensate for it Parameters State ON 1 I and Q signals are interchanged Inverted sideband Q j I OFF 0 I and Q signals are not interchanged Normal sideband I j Q RST 0 Manual operation See Swap I Q on page 80 TRACe IQ BWIDth This command defines or queries the bandwidth of the resampling filter The bandwidth of the resampling filter depends on the sample rate Parameters Bandwidth Default unit H...

Page 197: ...lt settings with TRACe IQ DATA the following minimum buffer sizes for the response data are recommended ASCII format 10 kBytes 4 Binary format 2 kBytes Parameters NORM 0 Default unit HZ This value is always 0 SampleRate Sample rate for the data acquisition Range 100 Hz to 10 GHz continuously adjustable RST 32000000 Default unit HZ TriggerMode Selection of the trigger source used for the measuremen...

Page 198: ...Q SRATe SampleRate This command sets the final user sample rate for the acquired I Q data Thus the user sample rate can be modified without affecting the actual data capturing settings on the R S FSV A Parameters SampleRate RST 32 MHz Default unit HZ Manual operation See Sample Rate on page 79 TRACe IQ TPISample This command queries the time offset between the sample start and the trigger event tr...

Page 199: ... 1 OFF 0 Switches the function off ON 1 Switches the function on Manual operation See Maximum Bandwidth on page 79 TRACe IQ WBANd MBWidth Limit Defines the maximum analysis bandwidth Any value can be specified the next higher fixed bandwidth is used Defining a value other than MAX is useful if you want to specify the sample rate directly and at the same time ensure a minimum bandwidth is available...

Page 200: ...ADJust LEVel 202 SENSe ADJust ALL This command initiates a measurement to determine and set the ideal settings for the current task automatically only once for the current measurement This includes Reference level Example ADJ ALL Manual operation See Adjusting all Determinable Settings Automatically Auto All on page 86 SENSe ADJust CONFigure DURation Duration In order to determine the ideal refere...

Page 201: ...O Manual operation See Resetting the Automatic Measurement Time Meastime Auto on page 87 See Changing the Automatic Measurement Time Meastime Manual on page 87 SENSe ADJust CONFigure HYSTeresis LOWer Threshold Parameters Threshold Range 0 dB to 200 dB RST 1 dB Default unit dB Example SENS ADJ CONF HYST LOW 2 For an input signal level of currently 20 dBm the reference level will only be adjusted wh...

Page 202: ...cy on page 86 SENSe ADJust LEVel This command initiates a single internal measurement that evaluates and sets the ideal reference level for the current input data and measurement settings This ensures that the settings of the RF attenuation and the reference level are optimally adjusted to the signal level without overloading the R S FSV A or limiting the dynamic range by an S N ratio that is too ...

Page 203: ...n permanently use the LAY SPL command see LAYout SPLitter on page 207 Suffix n Window Parameters Size LARGe Maximizes the selected window to full screen Other windows are still active in the background SMALl Reduces the size of the selected window to its original size If more than one measurement window was displayed originally these are visible again RST SMALl Example DISP WIND2 SIZE LARG 8 5 2 W...

Page 204: ...ontaining the name of the existing window the new win dow is inserted next to By default the name of a window is the same as its index To determine the name and index of all active windows use the LAYout CATalog WINDow query Direction LEFT RIGHt ABOVe BELow Direction the new window is added relative to the existing win dow WindowType text value Type of result display evaluation method you want to ...

Page 205: ...x of all active windows in the active channel from top left to bottom right The result is a comma separated list of values for each window with the syntax WindowName_1 WindowIndex_1 WindowName_n WindowIndex_n Return values WindowName string Name of the window In the default state the name of the window is its index WindowIndex numeric value Index of the window Example LAY CAT Result 2 2 1 1 Two wi...

Page 206: ...e name of an existing window the selected window is placed next to or replaces By default the name of a window is the same as its index To determine the name and index of all active windows in the active channel use the LAYout CATalog WINDow query Direction LEFT RIGHt ABOVe BELow REPLace Destination the selected window is moved to relative to the ref erence window Example LAY MOVE 4 1 LEFT Moves t...

Page 207: ...list of availa ble window types Example LAY REPL WIND 1 MTAB Replaces the result display in window 1 with a marker table Usage Setting only LAYout SPLitter Index1 Index2 Position This command changes the position of a splitter and thus controls the size of the win dows on each side of the splitter Note that windows must have a certain minimum size If the position you define con flicts with the min...

Page 208: ...Sweep and 3 Marker Peak List towards the top 70 of the screen The following commands have the exact same effect as any combination of windows above and below the splitter moves the splitter vertically LAY SPL 3 2 70 LAY SPL 4 1 70 LAY SPL 2 1 70 Usage Setting only LAYout WINDow n ADD Direction WindowType This command adds a measurement window to the display Note that with this com mand the suffix ...

Page 209: ...he default state the name of the window is its index Example LAY WIND2 IDEN Queries the name of the result display in window 2 Response 2 Usage Query only LAYout WINDow n REMove This command removes the window specified by the suffix n from the display in the active channel The result of this command is identical to the LAYout REMove WINDow command Suffix n Window Example LAY WIND2 REM Removes the...

Page 210: ...tput of the result data but it requires the control computer to wait actively for the response data Setting up the instrument starting the measurement via INIT and querying the result list at the end of the measurement see TRACe IQ DATA MEMory on page 266 With this method the control computer can be used for other activities during the measurement However the additional time needed for synchroniza...

Page 211: ...ands In this case you must interrupt processing on the remote channel first in order to abort the measurement To do so send a Device Clear command from the control instrument to the R S FSV A on a parallel channel to clear all currently active remote channels Depending on the used interface and protocol send the following commands Visa viClear Now you can send the ABORt command on the remote chann...

Page 212: ... you can synchronize to the end of the measurement with OPC OPC or WAI In continuous sweep mode synchronization to the end of the measurement is not possible Thus it is not recommended that you use continuous sweep mode in remote control as results like trace data or markers are only valid after a single sweep end synchronization For details on synchronization see the Remote Basics chapter in the ...

Page 213: ...ote Basics chapter in the R S FSV A User Manual Suffix n irrelevant Example INIT CONT OFF Switches to single sweep mode DISP WIND TRAC MODE AVER Switches on trace averaging SWE COUN 20 Sets the sweep counter to 20 sweeps INIT WAI Starts the measurement and waits for the end of the 20 sweeps Manual operation See Single Sweep Run Single on page 83 INITiate SEQuencer ABORt This command stops the curr...

Page 214: ...r details on synchronization see the Remote Basics chapter in the R S FSV A User Manual Parameters Mode SINGle Each measurement is performed once regardless of the chan nel s sweep mode considering each channels sweep count until all measurements in all active channels have been per formed CONTinuous The measurements in each active channel are performed one after the other repeatedly regardless of...

Page 215: ...ent This query returns the current number of started sweeps or measurements This com mand is only available if a sweep count value is defined and the instrument is in single sweep mode Return values CurrentCount Example SWE COUNt 64 Sets sweep count to 64 INIT CONT OFF Switches to single sweep mode INIT Starts a sweep without waiting for the sweep end SWE COUN CURR Queries the number of started sw...

Page 216: ...OFF 0 1 ON 1 The Sequencer is activated and a sequential measurement is started immediately OFF 0 The Sequencer is deactivated Any running sequential measure ments are stopped Further Sequencer commands INIT SEQ are not available RST 0 Example SYST SEQ ON Activates the Sequencer INIT SEQ MODE SING Sets single Sequencer mode so each active measurement will be performed once INIT SEQ IMM Starts the ...

Page 217: ...ow n DETector t FUNCtion AUTO 221 TRACe n COPY 222 SENSe AVERage n COUNt 222 TRACe IQ AVERage COUNt 222 SENSe AVERage n STATe t 222 TRACe IQ AVERage STATe 222 DISPlay WINDow n TRACe t MODE Mode This command selects the trace mode If necessary the selected trace is also activa ted In case of max hold min hold or average trace mode you can set the number of single measurements with SENSe SWEep COUNt...

Page 218: ...AC3 MODE WRIT Selects clear write mode for trace 3 INIT WAI Starts the measurement and waits for the end of the measure ment Manual operation See Trace Mode on page 90 DISPlay WINDow n SUBWindow w TRACe t MODE HCONtinuous State This command turns an automatic reset of a trace on and off after a parameter has changed The reset works for trace modes min hold max hold and average Note that the comman...

Page 219: ...ClrWrite Min Example DISP WIND3 TRAC PRES MCM In window 3 the traces are set to the following modes Trace 1 Max Hold Trace 2 Clear Write Trace 3 Min Hold DISPlay WINDow n SUBWindow w TRACe t STATe State This command turns a trace on and off The measurement continues in the background Suffix n Window w subwindow t Trace Parameters State ON OFF 0 1 OFF 0 Switches the function off ON 1 Switches the f...

Page 220: ...anual operation See Smoothing on page 91 DISPlay WINDow n SUBWindow w TRACe t SMOothing STATe State This command turns trace smoothing for a particular trace on and off If enabled the trace is smoothed by the value specified using DISPlay WINDow n SUBWindow w TRACe t SMOothing APERture on page 220 For more information see the R S FSV A User Manual Suffix n Window w subwindow t Trace Parameters Sta...

Page 221: ...IDeo Example AVER TYPE LIN Switches to linear average calculation Manual operation See Average Mode on page 91 SENSe WINDow n DETector t FUNCtion Detector Defines the trace detector to be used for trace analysis Suffix n Window t Trace Example DET POS Sets the detector to positive peak Manual operation See Detector on page 90 SENSe WINDow n DETector t FUNCtion AUTO State This command couples and d...

Page 222: ...n COUNt AverageCount TRACe IQ AVERage COUNt NumberSets This command defines the number of I Q data sets that the averaging is based on Parameters NumberSets Range 0 to 32767 RST 0 Example TRAC IQ ON Switches on acquisition of I Q data TRAC IQ AVER ON Enables averaging of the I Q measurement data TRAC IQ AVER COUN 10 Selects averaging over 10 data sets TRAC IQ DATA Starts the measurement and reads ...

Page 223: ...ng spectrograms the window suffix is irrelevant The settings are always applied to the spectrogram window or to all spectrogram windows if several are active for the same channel For commands to set markers in spectrograms see Chapter 8 7 3 4 Marker Search Spectrograms on page 242 8 7 2 1 Configuring a Spectrogram Measurement 223 8 7 2 2 Configuring the Color Map 228 8 7 2 1 Configuring a Spectrog...

Page 224: ...s command determines whether the results of the last measurement are deleted before starting a new measurement in single sweep mode This setting applies to all spectrograms in the channel Suffix n irrelevant Parameters State ON OFF 0 1 OFF 0 Switches the function off ON 1 Switches the function on Example INIT CONT OFF Selects single sweep mode INIT WAI Starts the sweep and waits for the end of the...

Page 225: ...s Frame Selects a frame directly by the frame number Valid if the time stamp is off The range depends on the history depth Default unit S Time Selects a frame via its time stamp Valid if the time stamp is on The number is the distance to frame 0 in seconds The range depends on the history depth Example INIT CONT OFF Stop the continuous sweep CALC SGR FRAM SEL 25 Selects frame number 25 Manual oper...

Page 226: ...te on page 94 CALCulate n SGRam STATe State CALCulate n SPECtrogram STATe State This command turns the spectrogram on and off Parameters State ON OFF 0 1 OFF 0 Switches the function off ON 1 Switches the function on Example CALC SGR ON Activates the Spectrogram result display CALCulate n SGRam THReedim STATe State CALCulate n SPECtrogram THReedim STATe State Activates or deactivates a 3 dimensiona...

Page 227: ...s however you can also calculate the absolute date and time as displayed on the screen The frame results themselves are returned with TRAC DATA SGR Query parameters Frames CURRent Returns the starting time of the current frame ALL Returns the starting time for all frames The results are sorted in descending order beginning with the current frame Return values Seconds Number of seconds that have pa...

Page 228: ...l operation See Time Stamp on page 95 8 7 2 2 Configuring the Color Map DISPlay WINDow n SGRam COLor DEFault 228 DISPlay WINDow n SPECtrogram COLor DEFault 228 DISPlay WINDow n SGRam COLor LOWer 228 DISPlay WINDow n SPECtrogram COLor LOWer 228 DISPlay WINDow n SGRam COLor SHAPe 229 DISPlay WINDow n SPECtrogram COLor SHAPe 229 DISPlay WINDow n SGRam COLor UPPer 229 DISPlay WINDow n SPECtrogram COLo...

Page 229: ...or SHAPe Shape This command defines the shape and focus of the color curve for the spectrogram result display Suffix n Window Parameters Shape Shape of the color curve Range 1 to 1 RST 0 Manual operation See Shape on page 97 DISPlay WINDow n SGRam COLor UPPer Percentage DISPlay WINDow n SPECtrogram COLor UPPer Percentage This command defines the end point of the color map Suffix n Window Parameter...

Page 230: ...ray RST HOT Example DISP WIND SPEC COL GRAY Changes the color scheme of the spectrogram to black and white Manual operation See Hot Cold Radar Grayscale on page 97 8 7 3 Using Markers The following commands are available for marker settings and functions in the I Q Ana lyzer application For I Q Vector displays markers are not available Setting Up Individual Markers 230 General Marker Settings 236 ...

Page 231: ...er m LINK State This command links delta marker m to marker 1 If you change the horizontal position x value of marker 1 delta marker m changes its horizontal position to the same value Tip to link any marker to a different marker than marker 1 use the CALCulate n DELTamarker ms LINK TO MARKer md or CALCulate n MARKer ms LINK TO MARKer md commands Suffix n Window m Marker Parameters State ON OFF 0 ...

Page 232: ...on of a delta marker is provided as an abso lute value or relative to a reference marker Note that when the position of a delta marker is queried the result is always an abso lute value see CALCulate n DELTamarker m X on page 233 Suffix n Window m irrelevant Parameters Mode ABSolute Delta marker position in absolute terms RELative Delta marker position in relation to a reference marker RST RELativ...

Page 233: ...F 0 Switches the function off ON 1 Switches the function on Example CALC DELT2 ON Turns on delta marker 2 Manual operation See Marker State on page 102 See Marker Type on page 102 See Select Marker on page 103 CALCulate n DELTamarker m TRACe Trace This command selects the trace a delta marker is positioned on Note that the corresponding trace must have a trace mode other than Blank If necessary th...

Page 234: ...n page 102 CALCulate n MARKer m AOFF This command turns off all markers Suffix n Window m Marker Example CALC MARK AOFF Switches off all markers Manual operation See All Marker Off on page 104 CALCulate n MARKer ms LINK TO MARKer md State This command links normal marker m1 to any active normal marker m2 If you change the horizontal position of marker m2 marker m1 changes its hori zontal position ...

Page 235: ... See Marker Type on page 102 See Select Marker on page 103 CALCulate n MARKer m TRACe Trace This command selects the trace the marker is positioned on Note that the corresponding trace must have a trace mode other than Blank If necessary the command activates the marker first Suffix n Window m Marker Parameters Trace Example Assign marker to trace 1 CALC MARK3 TRAC 2 Manual operation See Assigning...

Page 236: ...arker Settings The following commands control general marker functionality Remote commands exclusive to general marker functionality DISPlay WINDow n MTABle 236 DISPlay WINDow n MINFo STATe 236 CALCulate n MARKer m X SSIZe 237 DISPlay WINDow n MTABle DisplayMode This command turns the marker table on and off Suffix n irrelevant Parameters DisplayMode ON 1 Turns on the marker table OFF 0 Turns off ...

Page 237: ...uffix n irrelevant m irrelevant Parameters StepSize STANdard the marker moves from one pixel to the next POINts the marker moves from one sweep point to the next RST POINts Example CALC MARK X SSIZ STAN Sets the marker step size to one pixel Manual operation See Marker Stepsize on page 106 8 7 3 3 Configuring and Performing a Marker Search The following commands control the marker search CALCulate...

Page 238: ...on Excursion This command defines the peak excursion for all markers in all windows The peak excursion sets the requirements for a peak to be detected during a peak search The unit depends on the measurement Application Result display Unit Spectrum dB Suffix n irrelevant m irrelevant Example CALC MARK PEXC 10dB Defines peak excursion as 10 dB Manual operation See Peak Excursion on page 108 CALCula...

Page 239: ...windows If you perform a measurement in the time domain this command limits the range of the trace to be analyzed Suffix n irrelevant m irrelevant Parameters State ON OFF 0 1 OFF 0 Switches the function off ON 1 Switches the function on Example CALC MARK X SLIM ON Switches on search limitation Manual operation See Search Limits Left Right on page 108 See Deactivating All Search Limits on page 108 ...

Page 240: ...the marker search range for all markers in all windows If you perform a measurement in the time domain this command limits the range of the trace to be analyzed Suffix n irrelevant m irrelevant Parameters Limit The value range depends on the frequency range or sweep time The unit is Hz for frequency domain measurements and s for time domain measurements RST right diagram border Default unit HZ Exa...

Page 241: ...arker peak search for all markers in all windows Suffix n irrelevant Parameters Level Numeric value The value range and unit are variable RST 120 dBm Default unit DBM Example CALC THR 82DBM Sets the threshold value to 82 dBm Manual operation See Search Threshold on page 108 CALCulate n THReshold STATe State This command turns a threshold for the marker peak search on and off for all markers in all...

Page 242: ...RKer m SPECtrogram FRAMe 243 CALCulate n MARKer m SGRam SARea 243 CALCulate n MARKer m SPECtrogram SARea 243 CALCulate n MARKer m SGRam XY MAXimum PEAK 243 CALCulate n MARKer m SPECtrogram XY MAXimum PEAK 243 CALCulate n MARKer m SGRam XY MINimum PEAK 244 CALCulate n MARKer m SPECtrogram XY MINimum PEAK 244 CALCulate n MARKer m SGRam Y MAXimum ABOVe 244 CALCulate n MARKer m SPECtrogram Y MAXimum A...

Page 243: ...e 20th frame before the present CALC MARK2 SGR FRAM 2s Sets second marker on the frame 2 seconds ago Manual operation See Frame Spectrogram only on page 102 CALCulate n MARKer m SGRam SARea SearchArea CALCulate n MARKer m SPECtrogram SARea SearchArea This command defines the marker search area for all spectrogram markers in the channel Parameters SearchArea VISible Performs a search within the vis...

Page 244: ... See Search Mode for Next Peak in Y Direction on page 110 CALCulate n MARKer m SGRam Y MAXimum BELow CALCulate n MARKer m SPECtrogram Y MAXimum BELow This command moves a marker vertically to the next lower peak level for the current frequency The search includes only frames below the current marker position It does not change the horizontal position of the marker Suffix n Window m Marker Manual o...

Page 245: ...udes only frames above the current marker position It does not change the horizontal position of the marker Suffix n Window m Marker Manual operation See Search Mode for Next Peak in Y Direction on page 110 CALCulate n MARKer m SGRam Y MINimum BELow CALCulate n MARKer m SPECtrogram Y MINimum BELow This command moves a marker vertically to the next higher minimum level for the cur rent frequency Th...

Page 246: ...e following commands define the horizontal position of the delta markers CALCulate n DELTamarker m MAXimum LEFT on page 254 CALCulate n DELTamarker m MAXimum NEXT on page 255 CALCulate n DELTamarker m MAXimum PEAK on page 255 CALCulate n DELTamarker m MAXimum RIGHt on page 255 CALCulate n DELTamarker m MINimum LEFT on page 256 CALCulate n DELTamarker m MINimum NEXT on page 256 CALCulate n DELTamar...

Page 247: ...Tamarker m SPECtrogram Y MINimum NEXT 250 CALCulate n DELTamarker m SGRam Y MINimum PEAK 250 CALCulate n DELTamarker m SPECtrogram Y MINimum PEAK 250 CALCulate n DELTamarker m SGRam FRAMe Frame CALCulate n DELTamarker m SPECtrogram FRAMe Frame This command positions a delta marker on a particular frame The frame is relative to the position of marker 1 The command is available for the spectrogram S...

Page 248: ...m SGRam XY MAXimum PEAK CALCulate n DELTamarker m SPECtrogram XY MAXimum PEAK This command moves a marker to the highest level of the spectrogram over all fre quencies Suffix n Window m Marker CALCulate n DELTamarker m SGRam XY MINimum PEAK CALCulate n DELTamarker m SPECtrogram XY MINimum PEAK This command moves a delta marker to the minimum level of the spectrogram over all frequencies Suffix n W...

Page 249: ...he search includes all frames It does not change the horizontal position of the marker Suffix n Window m Marker Manual operation See Search Mode for Next Peak in Y Direction on page 110 CALCulate n DELTamarker m SGRam Y MAXimum PEAK CALCulate n DELTamarker m SPECtrogram Y MAXimum PEAK This command moves a delta marker vertically to the highest level for the current fre quency The search includes a...

Page 250: ...ELTamarker m SGRam Y MINimum NEXT CALCulate n DELTamarker m SPECtrogram Y MINimum NEXT This command moves a delta marker vertically to the next minimum level for the cur rent frequency The search includes all frames It does not change the horizontal position of the marker Suffix n Window m Marker Manual operation See Search Mode for Next Peak in Y Direction on page 110 CALCulate n DELTamarker m SG...

Page 251: ...m MINimum PEAK 254 CALCulate n MARKer m MINimum RIGHt 254 CALCulate n MARKer m MAXimum AUTO State This command turns an automatic marker peak search for a trace maximum on and off The R S FSV A performs the peak search after each sweep Suffix n Window m Marker Parameters State ON OFF 0 1 OFF 0 Switches the function off ON 1 Switches the function on Example CALC MARK MAX AUTO ON Activates the autom...

Page 252: ...moves a marker to the highest level In the spectrogram the command moves a marker horizontally to the maximum level in the currently selected frame The vertical marker position remains the same If the marker is not yet active the command first activates the marker Suffix n Window m Marker Manual operation See Peak Search on page 113 CALCulate n MARKer m MAXimum RIGHt This command moves a marker to...

Page 253: ...Auto Min Peak Search on page 108 CALCulate n MARKer m MINimum LEFT This command moves a marker to the next minimum value The search includes only measurement values to the right of the current marker posi tion In the spectrogram the command moves a marker horizontally to the minimum level in the currently selected frame The vertical marker position remains the same Suffix n Window m Marker Manual ...

Page 254: ... level in the currently selected frame The vertical marker position remains the same Suffix n Window m Marker Manual operation See Search Next Minimum on page 113 Positioning Delta Markers The following commands position delta markers on the trace CALCulate n DELTamarker m MAXimum LEFT 254 CALCulate n DELTamarker m MAXimum NEXT 255 CALCulate n DELTamarker m MAXimum PEAK 255 CALCulate n DELTamarker...

Page 255: ...moves a delta marker to the highest level In the spectrogram the command moves a marker horizontally to the maximum level in the currently selected frame The vertical marker position remains the same If the marker is not yet active the command first activates the marker Suffix n Window m Marker Manual operation See Peak Search on page 113 CALCulate n DELTamarker m MAXimum RIGHt This command moves ...

Page 256: ...vel in the currently selected frame The vertical marker position remains the same Suffix n Window m Marker Manual operation See Search Next Minimum on page 113 CALCulate n DELTamarker m MINimum PEAK This command moves a delta marker to the minimum level In the spectrogram the command moves a marker horizontally to the minimum level in the currently selected frame The vertical marker position remai...

Page 257: ...ulate n MARKer m FUNCtion BPOWer AOFF Removes all band power markers in the specified window Suffix n Window m irrelevant Example CALC MARK FUNC BPOW AOFF CALCulate n MARKer m FUNCtion BPOWer MODE Mode This command selects the way the results for a band power marker are displayed Note relative power results are only availabe for delta markers see CALCulate n DELTamarker m FUNCtion BPOWer MODE on p...

Page 258: ...C BPOW MODE DENS Query the result CALC MARK FUNC BPOW RES Response 20dBm Hz Usage Query only CALCulate n MARKer m FUNCtion BPOWer SPAN Span This command defines the bandwidth around the marker position Suffix n Window m Marker Parameters Span Frequency The maximum span depends on the marker position and R S FSV A model RST 5 of current span Default unit Hz Example CALC MARK FUNC BPOW SPAN 2MHz Mea...

Page 259: ...e way the results for a band power delta marker are dis played Suffix n Window m Marker Parameters Mode POWer Result is displayed as an absolute power The power unit depends on the CALCulate n UNIT POWer setting DENSity Result is displayed as a density in dBm Hz RPOWer This setting is only available for a delta band power marker The result is the difference between the absolute power in the band a...

Page 260: ...R S FSV A model RST 5 of current span Default unit Hz Manual operation See Span on page 119 CALCulate n DELTamarker m FUNCtion BPOWer STATe State This command turns delta markers for band power measurements on and off If neccessary the command also turns on a reference marker Suffix n Window m Marker Parameters State ON OFF 0 1 OFF 0 Switches the function off ON 1 Switches the function on Manual o...

Page 261: ... n MARKer m FUNCtion FPEaks ANNotation LABel STATe State This command turns labels for peaks found during a peak search on and off The labels correspond to the marker number in the marker peak list Suffix n Window m Marker Parameters State ON OFF 0 1 RST 1 Example CALC MARK FUNC FPE ANN LAB STAT OFF Removes the peak labels from the diagram Manual operation See Display Marker Numbers on page 123 CA...

Page 262: ...o be detected as a peak CALC MARK FUNC FPE 10 Initiates a search for 10 peaks on the current trace CALCulate n MARKer m FUNCtion FPEaks LIST SIZE MaxNoPeaks This command defines the maximum number of peaks that the R S FSV A looks for during a peak search Suffix n Window m Marker Parameters MaxNoPeaks Maximum number of peaks to be determined Range 1 to 200 RST 50 Example CALC MARK FUNC FPE LIST SI...

Page 263: ...s the function on Example CALC MARK FUNC FPE STAT ON Activates marker peak search Manual operation See Peak List State on page 122 CALCulate n MARKer m FUNCtion FPEaks X This command queries the position of the peaks on the x axis The order depends on the sort order that has been set with CALCulate n MARKer m FUNCtion FPEaks SORT Suffix n irrelevant m irrelevant Return values PeakPosition Position...

Page 264: ...mit reached error can occur although the hard disk indicates that storage space is still available To store data permanently select an external storage location such as a USB memory device For details see Protecting Data Using the Secure User Mode in the Data Manage ment section of the R S FSV3000 FSVA3000 base unit user manual Suffix n Window Parameters FileName String containing the path name an...

Page 265: ...Format Description for I Q Data Files on page 284 If only an extract of the available data is relevant use the TRACe n DATA MEMory command to store only the required section of data Retrieving Captured I Q Data 265 Retrieving I Q Trace Data 268 Exporting Traces and Data 271 Retrieving Marker Results 273 8 8 1 Retrieving Captured I Q Data The raw captured I Q data is output in the form of a list TR...

Page 266: ...es 4096 FORMat REAL 32 Selects format of response data TRAC IQ DATA Starts measurement and reads results TRACe IQ DATA FORMat Format This command selects the order of the I Q data For details see Chapter B Reference Format Description for I Q Data Files on page 284 Parameters Format COMPatible IQBLock IQPair COMPatible I and Q values are separated and collected in blocks A block 512k of I values i...

Page 267: ...el bar in manual opera tion and can be calculated as SampleRate CaptureTime See TRACe IQ SET TRACe IQ SRATe on page 198 and SENSe SWEep TIME on page 215 Query parameters OffsetSamples Selects an offset at which the output of data should start in rela tion to the first data If omitted all captured samples are output starting with the first sample Range 0 to of samples 1 with of samples being the ma...

Page 268: ...sition TRAC IQ DATA MEM 2048 1024 Reads 1024 I Q data from half of the recorded data TRAC IQ DATA MEM 100 512 Reads 512 I Q data starting at the trigger point Pretrigger Samples was 100 Example Perform a single I Q capture INIT WAI Determine output format binary float32 FORMat REAL 32 Read 1024 I Q samples starting at sample 2048 TRAC IQ DATA MEM 2048 1024 Usage Query only 8 8 2 Retrieving I Q Tra...

Page 269: ...ATA This command queries current trace data and measurement results The data format depends on FORMat DATA on page 268 Suffix n Window Query parameters ResultType Selects the type of result to be returned TRACE1 TRACE6 Returns the trace data for the corresponding trace SPECtrogram SGRam Returns the results of the spectrogram result display For details see Table 8 4 Return values TraceData Returns ...

Page 270: ...set and number of sweep points to be retrieved can be specified the trace data can be retrieved in smaller portions making the command faster than the TRAC DATA command This is useful if only specific parts of the trace data are of interest If no parameters are specified with the command the entire trace data is retrieved in this case the command returns the same results as TRAC DATA TRACE1 Suffix...

Page 271: ...decimal separator for data exported in ASCII format Parameters Separator POINt COMMa COMMa Uses a comma as decimal separator e g 4 05 POINt Uses a point as decimal separator e g 4 05 RST RST has no effect on the decimal separator Default is POINt Example FORM DEXP DSEP POIN Sets the decimal point as separator Manual operation See Decimal Separator on page 50 See Export Peak List on page 123 FORMat...

Page 272: ...o an ASCII file The trace parameter for the MMEMory STORe n TRACe command is ignored RST SINGle Manual operation See Export all Traces and all Table Results on page 98 MMEMory STORe n SPECtrogram FileName This command exports spectrogram data to an ASCII file The file contains the data for every frame in the history buffer The data corresponding to a particular frame begins with information about ...

Page 273: ... is still available To store data permanently select an external storage location such as a USB memory device For details see Protecting Data Using the Secure User Mode in the Data Manage ment section of the R S FSV3000 FSVA3000 base unit user manual Suffix n Window Parameters Trace Number of the trace to be stored FileName String containing the path and name of the target file Example MMEM STOR1 ...

Page 274: ... delta marker first Suffix n Window m Marker Return values Position Position of the delta marker in relation to the reference marker Example CALC DELT3 X REL Outputs the frequency of delta marker 3 relative to marker 1 or relative to the reference position Usage Query only CALCulate n DELTamarker m Y Suffix n 1 n m 1 n Return values Result Result at the position of the delta marker The unit is var...

Page 275: ...the path and name of the target file Example MMEM STOR LIST test Stores the current list evaluation results in the test dat file 8 9 Importing and Exporting I Q Data and Results Alternatively to capturing I Q data by the I Q Analyzer itself stored I Q data from previ ous measurements or other applications can be imported to the I Q Analyzer Further more I Q data processed in the I Q Analyzer can b...

Page 276: ...ters Format FLOat32 32 bit floating point format INT32 32 bit integer format RST FLOat32 DataFormat COMPlex Exports complex data REAL Exports real data RST COMPlex Example MMEM STOR IQ FORM INT32 REAL MMEMory STORe n IQ STATe 1 FileName Suffix n 1 n Parameters 1 FileName Manual operation See I Q Export on page 50 8 10 Programming Examples The following programming examples demonstrate how to captu...

Page 277: ...ngth number of samples to capture to 1000 samples TRAC IQ BWID Queries the bandwidth of the resampling filter determined by the sample rate FORM DATA REAL 32 Formats the data as 32 byte real values TRAC IQ DATA FORM IQBL Lists all I values first then all Q values in the trace results Configuring the Trace TRAC IQ AVER ON Defines averaging for the I Q trace TRAC IQ AVER COUN 10 Defines an average o...

Page 278: ... application RST Reset the instrument INIT CONT OFF Switches to single sweep mode TRACE IQ ON Switches the operating mode of the current measurement channel to I Q Analyzer while retaining the relevant parameters from the Spectrum mode Configuring Data Acquisition TRACE IQ SET NORM 0 32000000 IQP POS 0 1000 Configures the sample rate as 32 MHz IQP trigger positive trigger slope no pretrigger sampl...

Page 279: ...lyzers only For new remote control programs use the specified alternative commands CALCulate n FORMat 279 CALCulate n FORMat Evaluation This command selects the evaluation method of the measured data that is to be dis played in the specified window Note that this command is maintained for compatibility reasons only Use the LAYout commands for new remote control programs see Chapter 8 5 2 Working w...

Page 280: ...Remote Commands to Perform Measurements with I Q Data R S FSV A3000 I Q Analyzer 280 User Manual 1178 8536 02 01 Parameter value Window type RIMAG Real Imag I Q VECT I Q Vector Deprecated Commands ...

Page 281: ... 1178 8536 02 01 Annex A Formats for Returned Values ASCII Format and Binary Format 283 B Reference Format Description for I Q Data Files 284 C I Q Data File Format iq tar 286 C 1 I Q Parameter XML File Specification 287 C 2 I Q Data Binary File 290 ...

Page 282: ...Annex R S FSV A3000 I Q Analyzer 282 User Manual 1178 8536 02 01 ...

Page 283: ... separated values CSV of the measured val ues in floating point format Binary Format FORMat REAL 32 The data is stored as binary data Definite Length Block Data according to IEEE 488 2 each measurement value being formatted in 32 Bit IEEE 754 Floating Point Format The schema of the result string is as follows 41024 value1 value2 value n with 4 Number of digits 4 in the example of the following num...

Page 284: ...vidual values see Chapter A Formats for Returned Values ASCII Format and Binary Format on page 283 For details on the format of I Q export files using the I Q Export function see the R S FSV A User Manual Figure B 1 I Q data formats Note 512k corresponds to 524288 samples For maximum performance the formats Compatible or IQPair should be used Fur thermore for large amounts of data the data should ...

Page 285: ...he format QBLock the offset of Q data in the output buffer can be calculated as follows with LengthIndicatorDigits being the number of digits of the length indicator including the In the example above 41024 this results in a value of 6 for LengthIndica torDigits and the offset for the Q data results in 512 6 518 ...

Page 286: ...hin the archive without the need to unpack untar the tar file first Sample iq tar files If you have the optional R S FSV A VSA application R S FSV A K70 some sample iq tar files are provided in the C R_S Instr user vsa DemoSignals directory on the R S FSV A An application note on converting Rohde Schwarz I Q data files is available from the Rohde Schwarz website 1EF85 Converting R S I Q data files...

Page 287: ...spaceSchemaLocation RsIqTar xsd xmlns xsi http www w3 org 2001 XMLSchema instance Name R S FSV A Name Comment Here is a comment Comment DateTime 2011 01 24T14 02 49 DateTime Samples 68751 Samples Clock unit Hz 6 5e 006 Clock Format complex Format DataType float32 DataType ScalingFactor unit V 1 ScalingFactor NumberOfChannels 1 NumberOfChannels DataFilename xyz complex float32 DataFilename UserData...

Page 288: ...re allowed int8 8 bit signed integer data int16 16 bit signed integer data int32 32 bit signed integer data float32 32 bit floating point data IEEE 754 float64 64 bit floating point data IEEE 754 ScalingFactor Optional describes how the binary data can be transformed into values in the unit Volt The binary I Q data itself has no unit To get an I Q sample in the unit Volt the saved samples have to ...

Page 289: ...ed by current web browsers that have JavaScript enabled and if the XSLT stylesheet open_IqTar_xml_file_in_web_browser xslt is available Example ScalingFactor Data stored as int16 and a desired full scale voltage of 1 V ScalingFactor 1 V maximum int16 value 1 V 215 3 0517578125e 5 V Scaling Factor Numerical value Numerical value x ScalingFac tor Minimum negative int16 value 215 32768 1 V Maximum po...

Page 290: ... values are interleaved pairs of I and Q values and multi channel signals contain interleaved complex sam ples for channel 0 channel 1 channel 2 etc If the NumberOfChannels element is not defined one channel is presumed Example Element order for real data 1 channel I 0 Real sample 0 I 1 Real sample 1 I 2 Real sample 2 Example Element order for complex cartesian data 1 channel I 0 Q 0 Real and imag...

Page 291: ...Channel 1 Complex sample 1 I 2 1 Q 2 1 Channel 2 Complex sample 1 I 0 2 Q 0 2 Channel 0 Complex sample 2 I 1 2 Q 1 2 Channel 1 Complex sample 2 I 2 2 Q 2 2 Channel 2 Complex sample 2 Example Element order for complex cartesian data 1 channel This example demonstrates how to store complex cartesian data in float32 format using MATLAB Save vector of complex cartesian I Q data i e iqiqiq N 100 iq ran...

Page 292: ...57 SENSe FREQuency CENTer 182 SENSe FREQuency CENTer STEP 182 SENSe FREQuency CENTer STEP AUTO 183 SENSe FREQuency OFFSet 183 SENSe IQ BANDwidth MODE 193 SENSe IQ BANDwidth RESolution 194 SENSe IQ BWIDth MODE 193 SENSe IQ BWIDth RESolution 194 SENSe IQ FFT ALGorithm 194 SENSe IQ FFT LENGth 195 SENSe IQ FFT WINDow LENGth 195 SENSe IQ FFT WINDow OVERlap 195 SENSe IQ FFT WINDow TYPE 195 SENSe PMETer ...

Page 293: ...um NEXT 255 CALCulate n DELTamarker m MAXimum RIGHt 255 CALCulate n DELTamarker m MAXimum PEAK 255 CALCulate n DELTamarker m MINimum LEFT 256 CALCulate n DELTamarker m MINimum NEXT 256 CALCulate n DELTamarker m MINimum RIGHt 256 CALCulate n DELTamarker m MINimum PEAK 256 CALCulate n DELTamarker m MODE 232 CALCulate n DELTamarker m MREFerence 232 CALCulate n DELTamarker m SGRam FRAMe 247 CALCulate ...

Page 294: ...on BPOWer STATe 258 CALCulate n MARKer m FUNCtion CENTer 182 CALCulate n MARKer m FUNCtion FPEaks ANNotation LABel STATe 261 CALCulate n MARKer m FUNCtion FPEaks COUNt 261 CALCulate n MARKer m FUNCtion FPEaks LIST SIZE 262 CALCulate n MARKer m FUNCtion FPEaks SORT 262 CALCulate n MARKer m FUNCtion FPEaks STATe 263 CALCulate n MARKer m FUNCtion FPEaks X 263 CALCulate n MARKer m FUNCtion FPEaks Y 26...

Page 295: ...K 246 CALCulate n MARKer m TRACe 235 CALCulate n MARKer m X 235 CALCulate n MARKer m X SLIMits LEFT 239 CALCulate n MARKer m X SLIMits RIGHt 240 CALCulate n MARKer m X SLIMits ZOOM STATe 240 CALCulate n MARKer m X SLIMits STATe 239 CALCulate n MARKer m X SSIZe 237 CALCulate n MARKer m Y 274 CALCulate n MARKer m STATe 235 CALCulate n MARKer ms LINK TO MARKer md 234 CALCulate n PMETer p RELative STA...

Page 296: ...TYLe 230 DISPlay WINDow n TRACe t MODE 217 DISPlay WINDow n TRACe t Y SCALe 179 DISPlay WINDow n TRACe t Y SCALe AUTO ONCE 179 DISPlay WINDow n TRACe t Y SCALe PDIVision 180 DISPlay WINDow n TRACe t Y SCALe RLEVel 174 DISPlay WINDow n TRACe t Y SCALe RLEVel OFFSet 174 DISPlay WINDow n TRACe t Y SCALe RPOSition 180 DISPlay WINDow n SUBWindow w TRACe t MODE HCONtinuous 218 DISPlay WINDow n SUBWindow...

Page 297: ...INSTrument LIST 136 INSTrument REName 137 INSTrument SELect 137 LAYout ADD WINDow 204 LAYout CATalog WINDow 205 LAYout IDENtify WINDow 205 LAYout MOVE WINDow 206 LAYout REMove WINDow 206 LAYout REPLace WINDow 206 LAYout SPLitter 207 LAYout WINDow n ADD 208 LAYout WINDow n IDENtify 209 LAYout WINDow n REMove 209 LAYout WINDow n REPLace 209 MMEMory STORe n IQ COMMent 275 MMEMory STORe n IQ FORMat 27...

Page 298: ...PE 154 SYSTem COMMunicate RDEVice PMETer p CONFigure AUTO STATe 160 SYSTem COMMunicate RDEVice PMETer p COUNt 160 SYSTem COMMunicate RDEVice PMETer p DEFine 160 SYSTem COMMunicate TCPip RDEVice GENerator gen ADDRess 155 SYSTem PRESet CHANnel EXEC 138 SYSTem SEQuencer 216 SYSTem SPEaker MAXVolume 172 SYSTem SPEaker MUTE 172 SYSTem SPEaker VOLume 172 SYSTem SPEaker STATe 171 TRACe IQ AVERage COUNt 2...

Page 299: ...184 TRIGger SEQuence IFPower HYSTeresis 185 TRIGger SEQuence LEVel IFPower 186 TRIGger SEQuence LEVel IQPower 186 TRIGger SEQuence SLOPe 186 TRIGger SEQuence SOURce 187 TRIGger SEQuence TIME RINTerval 188 TRIGger tp SEQuence LEVel EXTernal port 185 UNIT n PMETer p POWer 166 UNIT n PMETer p POWer RATio 166 UNIT n POWer 173 ...

Page 300: ... Activating Deactivating 119 Deactivating 120 Power mode 119 Span 119 Band power measurement remote control 257 Bandwidth Analysis 79 Extension options 19 79 I Q Analyzer 18 Maximum usable 18 79 Relationship to sample rate 19 Settings 78 Branch for peak search I Q Analyzer 109 Brochures 6 C Calibration External generator 29 External generator remote 155 Normalization external generator 62 Referenc...

Page 301: ...lectronic input attenuation 67 Equalizer Data processing 17 Errors External generator 34 IF OVLD 66 Evaluation methods Remote 204 Example Remote control of an external generator 158 Exclude LO 107 Remote 238 Exporting Data 50 I Q data 37 45 50 125 286 290 I Q data remote 275 Measurement settings 98 Peak list 123 Softkey 48 Traces 48 50 97 99 100 External generator Activating Deactivating 59 Basics...

Page 302: ...7 58 Supported external generator 27 Getting started 5 GPIB Address External generator 58 External generator 57 TTL synchronization External generator 58 Group delay Smoothing 91 H Hardware settings Displayed 11 History Spectrograms 94 History Depth Softkey 94 Hold Trace setting 91 Hysteresis Lower Auto level 88 Trigger 75 Upper Auto level 87 I I Q Analyzer Data acquisition 17 Evaluation 13 I Q Ve...

Page 303: ...race 103 Markers Assigned trace 103 Band power remote control 257 Basic settings 101 Configuration 101 104 Configuration remote control 230 Deactivating 104 Delta markers 102 Fixed reference remote control 236 I Q vector 100 230 Linking 103 Minimum 113 Minimum remote control 237 251 Next minimum 113 Next minimum remote control 237 251 Next peak 113 Next peak remote control 237 251 Peak 113 Peak re...

Page 304: ...ntrol 260 Sort mode 123 State 122 Peak search Area spectrograms 111 115 Automatic 108 121 Deactivating limits 108 112 116 Excursion 120 Key 113 Limits 108 112 116 120 List 121 Mode 107 110 114 Mode spectrograms 109 110 114 115 Retrieving results remote 273 Threshold 108 112 116 Type spectrograms 111 115 Zoom limits 108 112 116 Peaks Marker positioning 113 Next 113 Softkey 113 Performance FFT param...

Page 305: ... 140 Remote 139 RF OVLD External generator 34 RUN CONT Key 83 95 RUN SINGLE Key 83 84 95 S Safety instructions 6 Sample rate Definition 18 Displayed 11 I Q Analyzer 18 I Q data 79 Maximum 18 Relationship to bandwidth 19 Remote 198 Scalar reflection measurement External generator 26 Scaling Configuration 69 Y axis 70 Y axis remote control 181 Search limits Deactivating 108 112 116 Search Limits Act...

Page 306: ...4 Clearing 85 96 Color curve 97 Color mapping 95 96 Color mapping remote control 228 Color scheme 97 Configuring remote control 223 Display depth 3 D 94 Frames remote control 223 History depth 94 Markers remote control 242 Selecting frames 84 94 Settings 93 Size 94 Timestamps 95 Spectrum I Q Analyzer 13 I Q Evaluation method 13 SRate hardware setting 11 Status bar Error messages external generator...

Page 307: ...put overload 140 Overload external generator 35 TTL handshake see TTL synchronization 58 TTL synchronization AUX control external generator 25 External generator 25 32 58 U Units Reference level 66 Upper Level Hysteresis 87 Usable I Q bandwidth Definition 18 User ports Remote control 171 User sample rate Definition 18 V Video Output 36 Volume Remote control 171 172 W White papers 6 Window function...

Reviews: