COMPASS-EI–Manual – Chapter 7
Page
57
7.1.3 SARA
Emissions
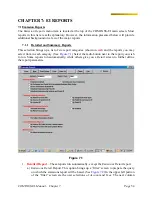
Emissions of SARA-flagged chemicals (See Section 4.1:
Contaminant Maintenance
for more
information. Only the SARA chemicals flagged by the user will appear in the report.) is
accomplished by selecting any of the
SARA
reports that are listed below each category. (See
Figure 7.3
) Each report shows SARA chemical emissions from the plant for the Year, and the
data is presented by Process Unit.
Figure 7.3
1.
SARA Summary Reports
– show the summary by contaminant name of uncontrolled,
annual, upset, maintenance, and total emissions.
2.
SARA Emissions Reports
– show several reports of SARA emissions for different
combinations of Process Unit, Source ID, and Point type or ID.
3.
Control Efficiency Reports
– show controlled and uncontrolled emissions, calculated
control efficiency, and amount abated.
4.
Comparisons of Current Year to Last Year
– show by contaminant name, comparisons
of either fugitive points, or flare and stack points.
7.1.4 Graphical
Report
This report graphs emissions by criteria pollutant category for the selected Account and Year,
plus the emissions for a different Year, on the same bar chart. The scope of the report may be
changed by the user to show plant-wide emissions, or emissions for a specified Process Unit,
Source or Point.

