21
Figure 7
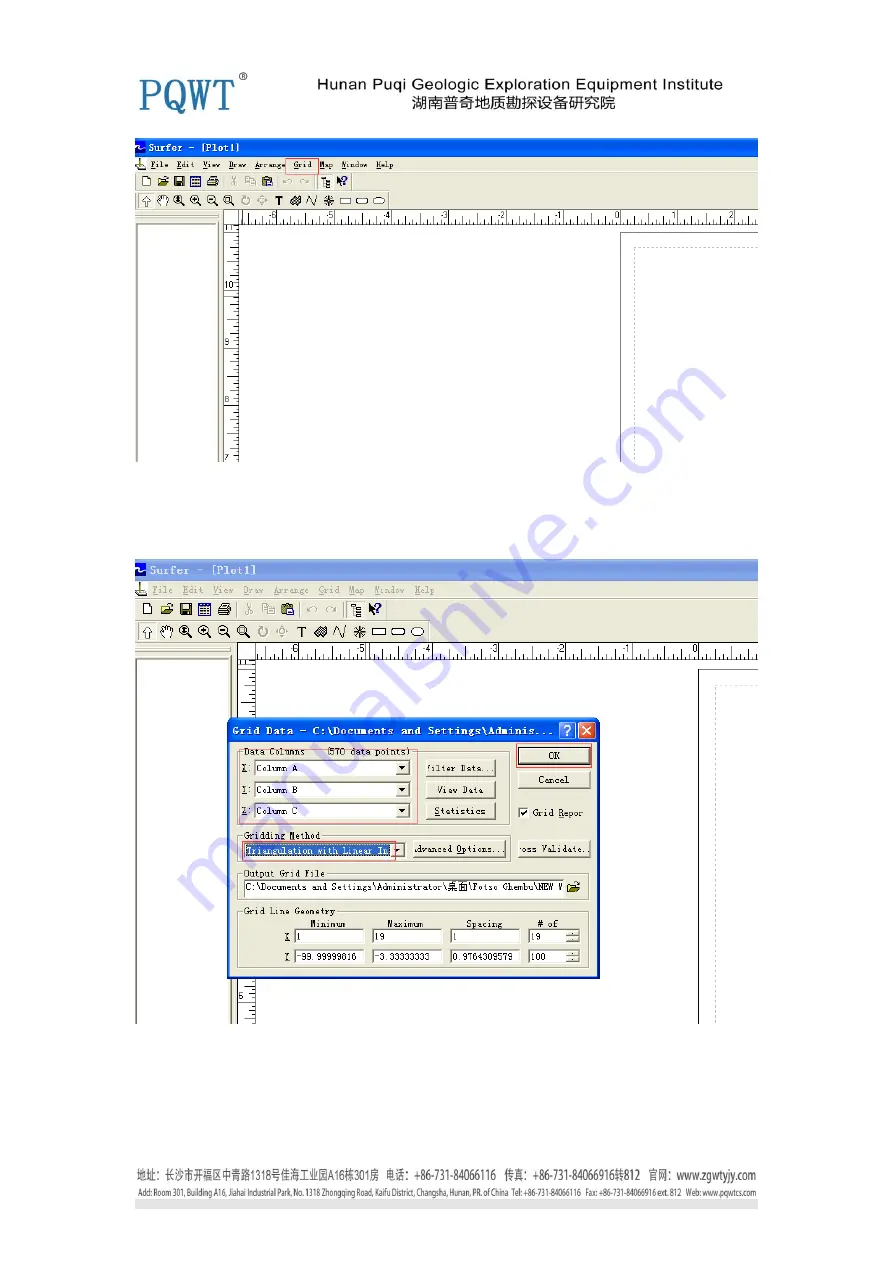
6.
Select “Grid-Data”, choose the new created Excel form above, then will choose the items as
shown in figure 8,
Figure 8
7.
Click “ Ok”. The file will be created as shown in figure 9.
Page 1: ...e 5 6 PQWT S150 5 PQWT S400 5 PQWT S500 6 Instrument Host Panel 6 7 The use of the Instrument 7 13 Instrument Works Introduction 7 Main Screen Description 7 11 M N Electrode Description 11 12 Wiring method 12 Data Transmission and Data Format 12 13 Instrument Drawing Methods 14 33 Case Show 33 Advised Measurement Approach 34 Configuration Table 35 Guide for After sale Services 35 Statement 35 ...
Page 2: ...l have to pay attention to the correct method of operation please do not fall equipment deliberately proper use will extend the life of the instrument 2 The instrument is not waterproof please do not immerse the instrument in water or operate in the rain 3 Please do not strike LCD screen do not expose the monitor for a long time in direct sunlight if there is a touch faulty please shutdown and res...
Page 3: ...rred to a computer drawing to form a cross sectional view the geological layer structure can be quickly determined by a clear understanding of cross sectional view orebody seam hollow cave water aquifer specific information Advantages High Measurement Speed high efficiency Complete more than 5000 10000 meters profile measurement in one day to realize geological abnormality in different depth the p...
Page 4: ...storage of data drawing curves The data will be saved automatically after the shutdown It can store 999 single band tri band and multi frequency measurement data Curves and data can be displayed directly also could be imported into computer directly for Charting Using rechargeable batteries Electrode detection power monitoring function PQWT S400 300 meter 0 01mv 6 Triple Multiple 320x420 DC12V 230...
Page 5: ...5 Instrument Structure and Name PQWT S150 PQWT S400 ...
Page 6: ...sign Special note the same cross sectional profile can only use the same anti interference option can not be converted repeatedly in the same cross section otherwise the data is not accurate affect judgment 4 Main Switch On off the instrument power 5 Electrode Detection Button Check M N electrode loop if communicated press the TEST Light up that is normal 6 Button Used for operating the instrument...
Page 7: ...desired operating frequency and then by the A D sampling central processor CPU for data processing Where in the entire measurement process high speed central processing unit CPU of the control instrumentation automatic range conversion and automatic frequency selection The last display of measured data and curves from the LCD graphic through computer data and curves print or transmit it Depending ...
Page 8: ...select Multi band option then press the OK button the instrument into the multi frequency measurement state related multi frequency measurements can be operated Delete To clear all data press button to move to the Delete press the OK button the right side of the instrument screen appears Clearing internal storing data 0 when to 100 means that all data cleared then exit automatically 1 Enter Tri ba...
Page 9: ...e screen below shows Wait sampling press the OK button to proceed the status bar below shows Sampling then DATA column shows the sampling data of three frequency 25Hz 67Hz 170Hz After sampling display Sampling is completed press OK to continue After the OK button is pressed again the number after the Site will plus 1 and then measure the data of next point You can repeat this step until you comple...
Page 10: ...nter Multi band measurement state LCD display is shown below in Figure 4 Figure 4 The display on Multi band Measurement Status Line The instrument can store 30 measuring line data Line numbers can be chosen from 1 to 30 The selected measuring line number is behind Line Enter the Multi band measurement status the first selected option is sampling Press the select Line then press OK button the curso...
Page 11: ... be transferred for example due to the U disk and the host does not recognize or U disk and host poor contact then the status bar will complain Return Select Return and press the OK button the graphics display content will be from Figure 4 Tri band Mode back to Figure 2 main screen status Note Please don t shut down the instrument when it is measuring otherwise it will cause data loss or program c...
Page 12: ...in figure 6 Electrode spacing is generally 5 10m Choose 6 8 10m according to your actual situation dot spacing is generally about 0 5 2m electrode spacing and dot spacing must keep the same distance for one measuring line M N is electrode O is the first measurement point O1 is the second measurement point NM 5 10M measuring point spacing is generally 0 5 2m Figure 6 Data Transmission and Data Form...
Page 13: ...0 software you can open the file directly Data Format Tri band Display Format in MY_DAT file The first column A column Line number The second column B column 1 2 3 4 30 indicate measuring point number The third column C column Indicates the measured data of 25HZ The fourth column D column Indicates the measured data of 67HZ Fifth column E column Indicates the measured data of 170HZ Multi band Disp...
Page 14: ... Drawing Methods Method No 1 Line Chart 1 Open the record data as shown in figure 1 Figure 1 2 Copy all values exclude L and N columns as shown in figure 2 Figure 2 3 Then paste to the red area as shown in figure 3 ...
Page 15: ...15 Figure 3 4 Select all coiped data as shown in figure 4 Figure 4 5 Then click Insert Chart Line as shown in figure 5 ...
Page 16: ...16 Figure 5 6 Select the first group in Line then click Next as shown in figure 6 Figure 6 7 Choose Columns then click Finish as shown in figure 7 ...
Page 17: ...17 Figure 7 8 Now the Line Chart is finished Judge from the chart point 13 will be recommended to drill Figure 8 Method No 2 Contour Map ...
Page 18: ...he recorded data copy all velaues exclude L and N columns as shown in figure 1 Figure 1 2 Then the values through Paste Special Values Transpose to the steps and position as shown in figure 2 and figure 3 Figure 2 ...
Page 19: ...ty of points you record the quantity of groups which are copied For example there are 19 sets of data above copy until No 19 set as shown in figure 4 Figure 4 4 After copy create a new EXCEL form then through Paste Special Values as shown in figure 5 and figure 6 ...
Page 20: ...20 Figure 5 Figure 6 After Click Ok then click Save 5 Next step is drawing launch the interface as shown in figure 7 ...
Page 21: ...21 Figure 7 6 Select Grid Data choose the new created Excel form above then will choose the items as shown in figure 8 Figure 8 7 Click Ok The file will be created as shown in figure 9 ...
Page 22: ... Then select Map Contour Map New Contour Map choose the file saved above as shown in figure 10 Figure 10 Here the contour map is created 9 Double click the map above then will appear dialog box as shown in figure 11 ...
Page 23: ...23 Figure 11 10 Check Fill Contour Smooth Contours Color Scale Choose Amount High Then choose Levels Fill Foregroud Load as shown in figure 12 13 14 Figure 12 ...
Page 24: ...24 Figure 13 Figure 14 Load the file as shown in figure 15 Figure 15 11 Then select Scale as shown in figure 16 ...
Page 25: ...25 Figure 16 12 Then cross off Proportional XY Scale modify length of X Scale and Y Scale as shown in figure 17 Figure 17 Click Apply and Ok as shown in figure 18 ...
Page 26: ...se Scaling moify Major and First Major as 1 Last Major 19 as shown in figure 19 Figure 19 11 Then click ok here Contour Map is finished as shown in figure 20 The data of Y axis is the detection depth the data of X axis is the detection points ...
Page 27: ...27 Figure 20 Here the contour map is finished ...
Page 28: ... This method need some experience you can learn after a few times 1 Open the Record data then make the Line Chart as Method No 1 as show below in Figure 1 Figure 1 2 Here you need to select Reference Line Reference Point Reference line selection requirement is the most gentle one as shown below in figure 2 Figure 2 The chosen reference line of data corresponding to the data in the table above as s...
Page 29: ...row mark colour for column and row on the form as shown below in figure 3 Figure 3 3 Copy the row of marking color paste it into the right position AT 1 as shown below in figure 4 Figure 4 4 Copy the value of two color crossed to red value area as shown in figure 5 below Figure 5 ...
Page 30: ... using the data in red frame above then compare with the original line chart as shown below in figure 7 Figure 7 7 Generally the water area we judge based on low values but the data above too many high values it covers many low values We can find that the main values in the area below 0 2 so we ...
Page 31: ... 8 Based on this method lower other high values into 0 2 area then the line chart will be changed as shown below in figure 9 you can find that other low values will be more obvious than the original one Figure 9 8 Then copy the changed data in the red box through Paste value Transpose steps to the green area as shown in figure 10 ...
Page 32: ...make the graph according to the method No 2 above here is the contrast between Data Assimilation and Contour Map It s the graph according to the original data in figure 11 the point 11 is recommended Figure 11 Here the Data Assimilation graph is finished ...
Page 33: ... actual case diagram of Douala Cameroon The field prospecting is completely consistent with drilling result Well position was designed with 13 walls 45m deep After well completion there is 9 m3 water per hour to which client was very satisfield ...
Page 34: ...e the location of the abnormal ground point generally using lining rope as straight line carry out paint markers at the beginning or middle position so that find the corresponding position according to the test results of graph after measuring Cross Method Grid Method ...
Page 35: ...ne Engine 1 Copper Cable 1 Charger 1 Electrode Bar 1 Copper Electrode 1 Operation Manual 1 Warranty Card 1 Outer Box 1 Copyright Notice 1 Hunan Puqi Geologic Exploration Equipment Institute has the final interpretation of the operating instructions 2 Hunan Puqi Geologic Exploration Equipment Institute reserves right to modify equipment specification without any advance notice 3 All pictures for re...