A
‐
scan
mode:
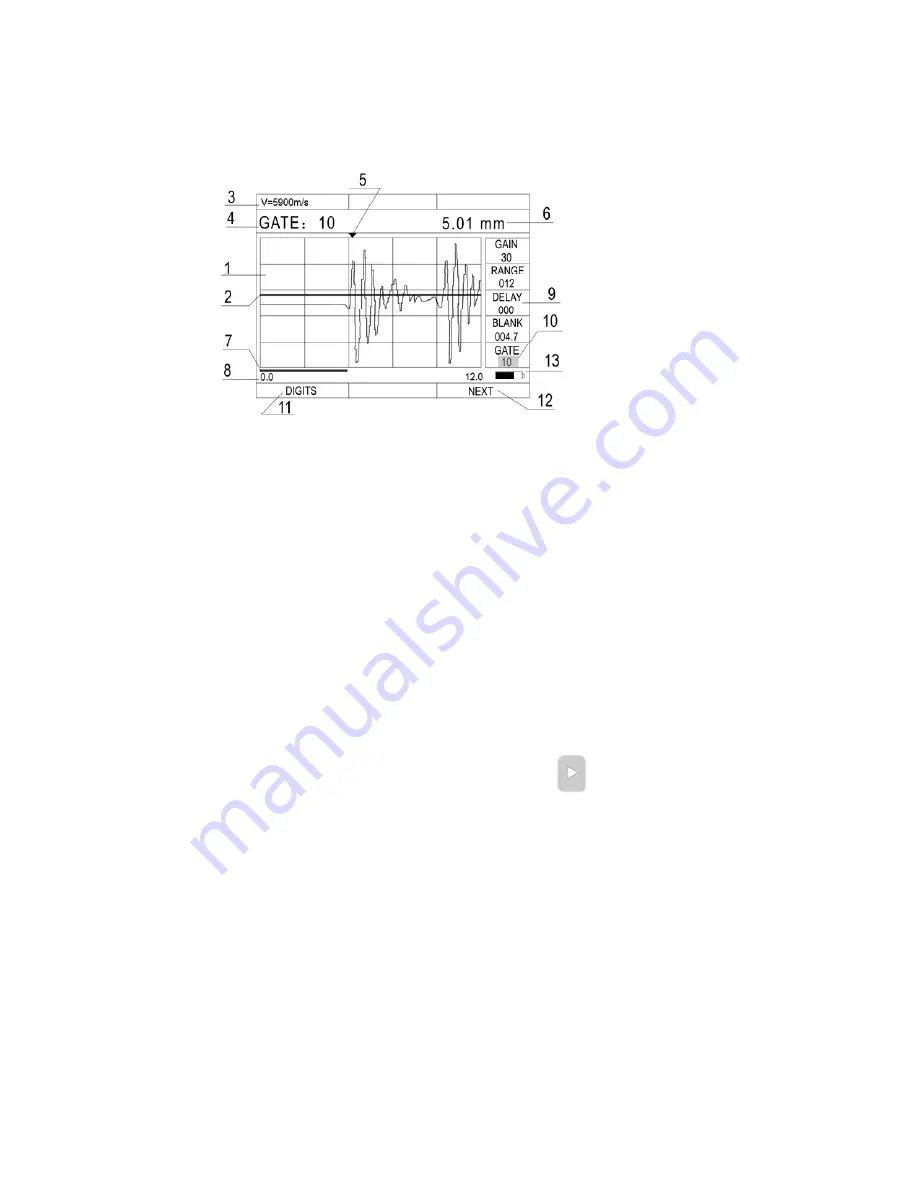
This interface allows you to see the present thickness value and the A‐scan waveform at
the same time. The right side of the interface is the specification adjusting area, which can be adjusted
for a more precise result. The detailed introduction can be seen in chapter 3.5.
3.7 A‐SCAN MODE INTERFACE
1—waveform display area 2—gate 3—material velocity 4—the present highlighted
specification 5—measuring point( the first point of intersection between the waveform and the gate)
6—the present thickness value 7—the blank confines
8—the range confines 9—the specification adjusting area 10—highlighted signal
11—digit mode 12—specification switch 13—battery power
ATTENTION:
When the probe and the object are not completely coupled, the letters in the various
interfaces are shown in
GREEN,
when properly coupled, they are displayed in
WHITE
color and when
the either the upper or lower limits are exceeded, the letters are displayed in
RED
color.
3.5
ADJUSTING
THE
SPECIFICATIONS
IN
A
‐
SCAN
INTERFACE
In the A‐scan interface, press the bottom right button NEXT to highlight the value to be adjusted.
Then press the direction keys to adjust the values. Up and down keys are used for small increments,
while left and right for larger increments.
GAIN
—adjust the sensitivity of the gage with unit dB. The larger the gain is, the higher the sensitivity is.
The gain ranges from 8 to 55dB.
RANGE
—adjust the testing range that the screen displays. The range is 0.393” to 5.70” (10~145mm).
DELAY
—shown at the beginning point of the screen. The waveform will move horizontally when
adjusting this value.


