[email protected]
26
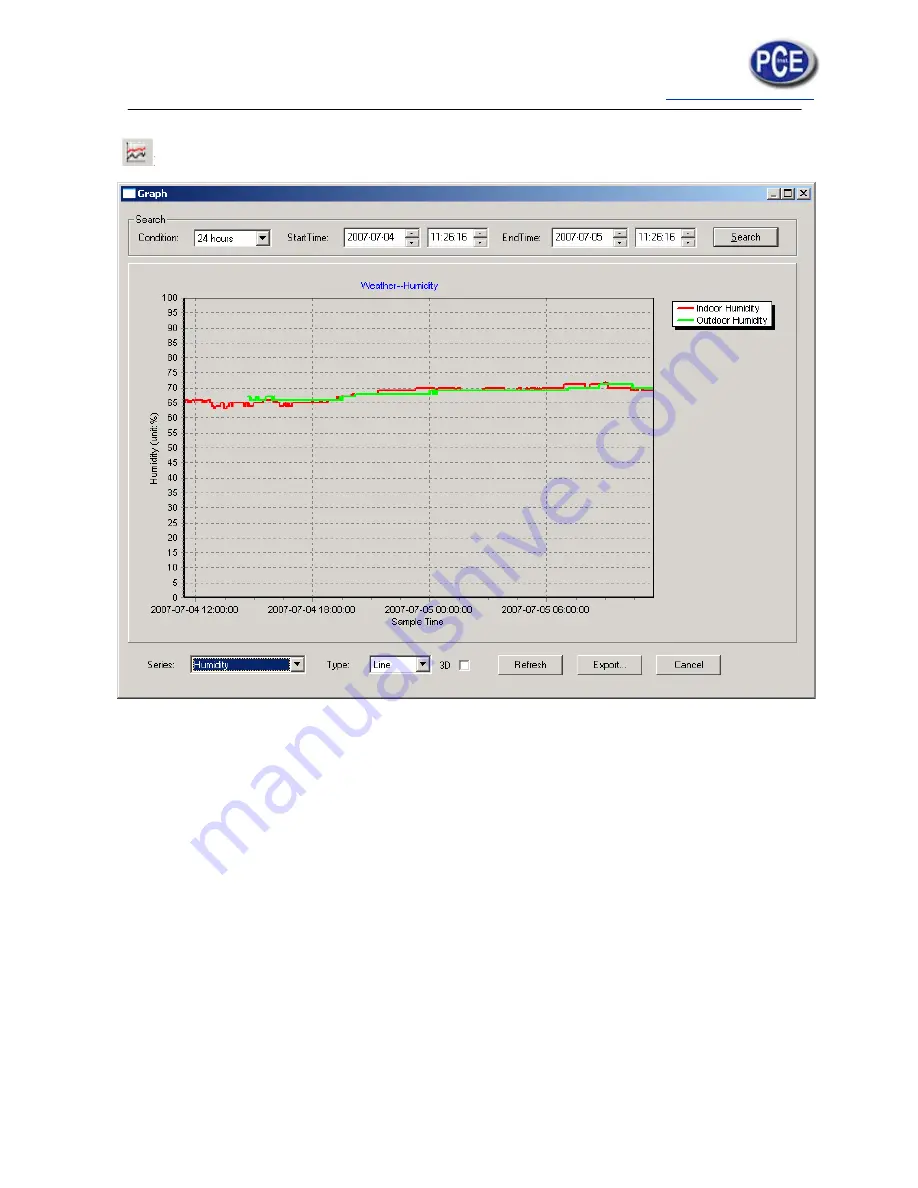
: display history data in graph mode
In this section, you can see the history data plotted in graph format for easier observation. If
you want to see more details, just use your mouse to select the area you wanted and the
display will be automatically updated in more detailed scale:


