®
B a s i c O p t i c s S y s t e m
T e a c h e r ’ s G u i d e
50
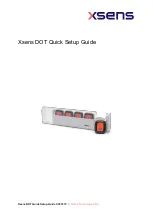
Typical results:
Typical ray-tracing results are represented at
50% scale in Figure TG.1. The gray regions
represent the actual light beams; the black
lines and dots represent the student’s actual
marks. Notice that this student traced along the
edges of the light beams.
The actual thickness of the rhombus is
t
= 3.175 ± 0.025 cm. Based on the accepted
value of
n
= 1.49, the theoretical apparent
depth is
d
= 2.13.
Answers to questions:
1.
Of the two methods, the parallax method is the more precise. Using that method,
both
d
and
t
could be measured with a precision of less than 1 mm. Using the ray-tracing method, the points at
which the rays crossed had a larger uncertainty due to the thickness of the light beams.
2.
For the typical data
above, the percent differences between the accepted and experimental values of
n
are 0.7% for Part 1 and 5% for
Part 2.
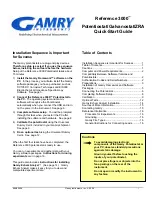
Typical results:
Table 1.1: Results
d
t
n
Part 1: Parallax method
2.12 cm
3.18 cm
1.50
Part 2: Ray-tracing method
2.23 cm
3.18 cm
1.43
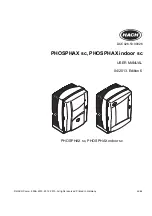
Trial 1
Ray Incident on Flat Surface
Trial 2
Ray Incident on Curved Surface
Angle of Incidence
θ
i1
Angle of Refraction
θ
r1
Angle of Incidence
θ
i2
Angle of Refraction
θ
r2
0°
0
0
1.0
10°
7.0
7.0
7.5
20°
13.5
13.5
19.5
30°
20.0
20.0
30.0
40°
25.5
25.5
39.0
50°
31.0
31.0
49.0
60°
35.5
35.5
59.0
70°
39.5
39.5
70.0
80°
41.0
41.0
77.0
2.23 cm
Figure TG.1
Summary of Contents for OS-8515B
Page 6: ... Basic Optics System About the Experiments 6 ...
Page 26: ... Basic Optics System Experiment 9 Apparent Depth 26 ...
Page 38: ... Basic Optics System Experiment 13 Telescope 38 ...
Page 42: ... Basic Optics System Experiment 14 Microscope 42 ...
Page 44: ... Basic Optics System Experiment 15 Shadows 44 ...
Page 46: ... Basic Optics System Telescope and Microscope Test Pattern 46 ...