background image

Plunger Cart

Experiments

22

012-14781A

If the acceleration is uniform, Eqn. 2 equals Eqn. 3. You can use the measured values of the angle 

ø (the angle of uniform acceleration), the distance d, and the time t to calculate the kinetic coefficient 

of friction µ

k

.

Procedure

NOTE: To get consistent results in this experiment, you must insure that the ramp you will be using 

is both straight and clean. Wipe the surface of the ramp and the friction block with a rag.

Determining the coefficient of kinetic or "sliding" friction:
1. Place the cart with the friction block on the ramp. Set up the ramp at a relatively low angle (one that 

does not cause the friction block to begin sliding down the ramp by itself). 

2. Increase the angle of the ramp until the block begins to slide down the ramp on its own, but only 

after you “release” it by slapping the table (or tapping the ramp very lightly). Now increase the angle 

of the ramp by a few more degrees, so that the block will slide down the ramp with a uniform 

acceleration when you release it with a “slap” or tap. The angle of the ramp must be low enough 

so that the block does not begin to slide on its own only when you release it. Measure the angle of 

the ramp with the protractor and record it as the angle of uniform acceleration (ø) in the data table.

3. Release the block from the grasp of static 

friction as described in the previous step and 

measure the time of the cart’s descent down 

the ramp. Record this time as t in data Table 

6.1. Measure the distance d that the block 

slides down the ramp and record this data in 

Table 6.1. Repeat the measurements four 

times. Use Eqn. 3 to compute the accelerations 

of the block and enter the values in data Table 

6.1. Determine the average value of accelera

-

tion and enter it below data Table 6.1. 

4. Use Eqn. 2 to calculate the coefficient of kinetic or “sliding” friction. Enter it below the data table.
Prediction of D and Measurement of D:
5. Now slightly reduce the angle of the ramp until the block will just barely slide down the ramp with a 

uniform speed when you release it with a slap or tap. Measure this “slip” angle. Reduce the angle 

of the ramp to about one half of the “slip” angle. Measure this new angle and record its value in 

data Table 6.2 as 

. Secure a brick or block at the upper end of the ramp as shown in Figure 6.2.   

6. It is time to make a prediction – Using Eqn.1 and the information that you have recorded, predict 

D, the distance that the car will slide down the ramp after being launched. Assume that the plunger 

on the cart is fully cocked at the position of maximum spring compression. Record your prediction 

at the top of Table 6.2.

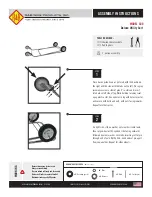
7. After double checking your work in the previous step, launch the cart down the ramp by placing it 

on the ramp with its cocked plunger against the secured brick. Then tap the Plunger Trigger with a 

rod or stick using a flat edge.
NOTE: This will help to insure that you do not give the car an initial velocity other than that supplied 

by the spring plunger. 

8. For six trials, measure the distance D that the car slides and record these in Table 6.2. 
NOTE: Sometimes the car will twist a bit as it descends, so use the midpoint of the back edge of your 

car as a reference point for measuring D.

9. Compare your results with your prediction. Compute the percent difference between these two 

q

Figure 6.2

Brick or Block

(about 1/2 the slip angle)

Summary of Contents for ME-9430

Page 1: ...k and loop Velcro tabs on the plunger end for inelastic collision studies The magnets can be used for elastic collisions studies The spring plunger has three set ting positions and is released by a pl...

Page 2: ...Retention Bar and push the plunger a little farther into the Plunger Cart Slightly raise the end of the plunger and push the plunger until you hear or feel the second click Position 2 To release the p...

Page 3: ...ormation about the latest revision of this Instruction Manual visit www pasco com manuals and enter the Product Number For information about the Plunger Carts or any PASCO product what software to use...

Page 4: ...prings Pull the baseplate with one hand and cover the wheel axle area with the other hand This will help keep the wheel axle assembly from popping out 1 Using a Phillips screwdriver remove the screws...

Page 5: ...e velocity over this interval is given by the following equation Ifthe acceleration of the cartis constant as it rolls to a stop over the floor then the initial instantaneous velocity of the Plunger C...

Page 6: ...ger in and then push the plunger slightly upward to allow one of the notches on the plunger bar to catch on the edge of the small metal bar at the top of the hole Don t count the trials in which the t...

Page 7: ...he same course but in the opposite direction For example if the first few runs are toward the east then the next few runs will be toward the west See Figure 2 1 In the direction which is slightly down...

Page 8: ...3 Using Eqn 3 compute the accelerations corresponding to your data and an average acceleration for each of the two directions 4 Using the results of step 3 determine r and by algebraically solving for...

Page 9: ...erimentally determined and this value will be compared to the acceleration predicted by Newton s Second Law Theory The cart will be released from rest and allowed to accelerate over a distance d Using...

Page 10: ...oop and pull the cart back to a clearly marked starting point Determine the distance d that the Plunger Cart will move from the starting point to the bumper block and record this distance at the top o...

Page 11: ...781A 11 Table 3 1 Question 1 Can you think of any systematic errors that would effect your results Explain how each would skew your results Trial m g Average time s aexp cm s2 ath cm s2 Diff 1 10 2 20...

Page 12: ...Plunger Cart Experiments 12 012 14781A NOTES...

Page 13: ...ce k is known it is possible to predict the launch velocity vo by using conservation of energy since the elastic potential energy stored in the spring is converted into kinetic energy at the time of l...

Page 14: ...s the spring constant for your car Show your slope calculations on the graph and record k below 6 Determine the mass of the cart using a mass balance and record this value below 7 Using Eqn 3 and your...

Page 15: ...___________ m Predicted value of launch velocity v0 _______________ m s Average d ____________________m Average t ________________ s Observed value of the launch velocity v0 _________________ m s Perc...

Page 16: ...Plunger Cart Experiments 16 012 14781A NOTES...

Page 17: ...the percussionpoint We will call this zero impulse sweetspot SS2 For a given bat and pivot the position of SS2 can be found from where I is the rotational inertia of the bat for the corresponding pivo...

Page 18: ...location of SS2 and record it below Table 5 1 8 If time permits repeat the above after either repositioning the pivot i e choking up or adding 100 grams or so at some point on the stick NOTE This wou...

Page 19: ...5 100 PRINT TAB 5 r TAB 20 v TAB 39 w TAB 60 DeltaP NEXT PRINT PRINT INPUT Wouldyouliketoinputdifferentvalues a IF a N and a n GOTO Begin END REM Program SWEET SPOTS and PER CUSSION POINTS Fixed Pivo...

Page 20: ...Plunger Cart Experiments 20 012 14781A NOTES...

Page 21: ...icient of kinetic or sliding friction In this experiment you will use the principle of the conservation of energy to predict D given certain measurements you will make and the value of k determined in...

Page 22: ...urements four times UseEqn 3tocomputetheaccelerations of the block and enter the values in data Table 6 1 Determine the average value of accelera tion and enter it below data Table 6 1 4 Use Eqn 2 to...

Page 23: ...iction ______________ Predicted value of D ________________ cm Table 6 2 Average of measured value of D _________________ cm Percent difference ____________ Questions 1 In analyzing this system has th...

Page 24: ...Plunger Cart Experiments 24 012 14781A NOTES...

Reviews: