Plunger Cart
Experiments
14
012-14781A
Procedure
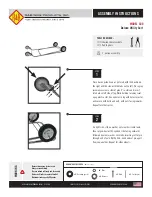
1. Stand the Plunger Cart on its end so that the spring plunger is aimed up, as shown in Figure 4.1.
Using masking tape or rubber bands, fix a ruler to the car and adjust it so that the 0 cm mark on
the ruler lines up with the upper surface of the plunger. Take care to avoid parallax errors!
2. Carefully add enough mass to the top of the plunger so that it is nearly fully depressed. Record this
mass and the corresponding compression x (initial position) of the spring in Table 4.1.
3. Remove approximately one quarter of the mass used in step 2. Record the new mass and x values
in Table 4.1.
4. Repeat step 3 until no mass remains on the plunger.
5. Plot a graph of F versus x using your data and determine the slope of the best line through your
data points. This slope is the spring constant for your car. Show your slope calculations on the graph
and record k below.
6. Determine the mass of the cart using a mass balance and record this value below.
7. Using Eqn. 3 and your values for m, x
o
(i.e. the compression of the cocked spring) and k, predict
the launch velocity of your cart and record this below.
8. Cock the spring plunger to the value of x
o
that you have chosen, then place the cart in its starting
position and launch it. Using a stopwatch and a meter stick, determine the average range d and
the average total time spent rolling t. Record these below.
NOTE: To avoid reaction time errors, the person who launches the cart should also time the cart’s
motion.
9. Using Eqn. 4, determine the observed value of v
o
and compare it with the predicted value.
Total added mass
Pan for holding masses
Note the initial position
of the plunger
15 cm ruler attached
to the Plunger Cart
1/2 total added mass
Note the final position
of the plunger
Note the new position
of the plunger
1
2
3
Figure 4.1