PASCO AP-8209, Instruction Manual
The PASCO AP-8209 Instruction Manual is available for free download on our website. This manual provides users with detailed instructions on how to operate and maintain the product. Download your copy today from manualshive.com to ensure you get the most out of your PASCO AP-8209 experience.
Share
Download


Reviews:
No comments
Related manuals for AP-8209
C300
Brand: Calistair Pages: 44
T Series
Brand: Pall Pages: 51
7600 Series
Brand: Campden instruments Pages: 8
4000 Series
Brand: Omni Pages: 193
ImageQuant LAS 4000
Brand: GE Pages: 86
AKTA avant
Brand: GE Pages: 134
AKTApure
Brand: GE Pages: 160
25
Brand: Labnet Pages: 5
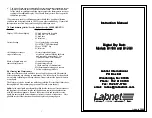
D1200
Brand: Labnet Pages: 2
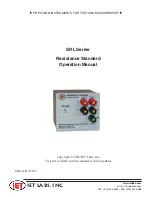
SRL Series
Brand: iET Pages: 17

AKTAprocess
Brand: GE Pages: 16
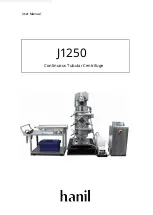
J1250
Brand: Hanil Pages: 60
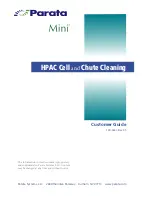
Mini
Brand: Parata Pages: 40
5000
Brand: YSI Pages: 70
150
Brand: Raith Pages: 26
3G
Brand: Haenim Pages: 2
7200
Brand: Labokey Pages: 5

D-IMager EKL3104
Brand: Panasonic Pages: 13


