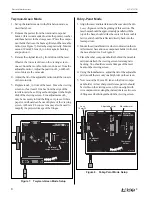
Precision Interferometer
012-07137B
14
®
4.
Be sure that the air in the vacuum cell is at atmospheric pressure. If you are using the OS-8502 Hand-
Held Vacuum Pump, this is accomplished by flipping the vacuum release toggle switch.
5.
Record
P
i
, the initial reading on the vacuum pump gauge. Slowly pump out the air in the vacuum cell. As
you do this, count
N
, the number of fringe transitions that occur. When you're done, record
N
and also
P
f
, the final reading on the vacuum gauge. (Some people prefer to begin with the vacuum cell evacuated,
then count fringes as they let the air slowly out. Use whichever method is easier for you.)
➤
NOTE:
Most vacuum gauges measure pressure with respect to atmospheric pressure (i.e., 34 cm Hg
means that the pressure is 34 cm Hg below atmospheric pressure, which is
~
76 cm Hg). The actual
pressure inside the cell is:
P
absolute
= P
atmospheric
– P
gauge
Analyzing Your Data
As the laser beam passes back and forth between the beam-splitter and the movable mirror, it passes
twice through the vacuum cell. Outside the cell the optical path lengths of the two interferometer beams
do not change throughout the experiment. Inside the cell, however, the wavelength of the light gets longer
as the pressure is reduced.
Suppose that originally the cell length,
d
, was 10 wavelengths long (of course, it's much longer). As you
pump out the cell, the wavelength increases until, at some point, the cell is only 9-1/2 wavelengths long.
Since the laser beam passes twice through the cell, the light now goes through one less oscillation within
the cell. This has the same effect on the interference pattern as when the movable mirror is moved
toward the beam-splitter by 1/2 wavelength. A single fringe transition will have occurred.
Originally there are
N
i
= 2
d
/
λλλλλ
i
wavelengths of light within the cell (counting both passes of the laser
beam). At the final pressure there are
N
f
= 2
d
/
λλλλλ
f
wavelengths within the cell. The difference between
these values,
N
i
– N
f
, is just
N
, the number of fringes you counted as you evacuated the cell. Therefore:
N
= 2
d
/
λλλλλ
i
- 2
d
/
λλλλλ
f
.
However,
λλλλλ
i
=
λλλλλ
0
/
n
i
and
λλλλλ
f
=
λλλλλ
0
/
n
f
; where
n
i
and
n
f
are the initial and final values for the index of
refraction of the air inside the cell. Therefore
N
= 2
d
(
n
i
–
n
f
) /
λλλλλ
0
; so that
n
i
–
n
f
=
N
λλλλλ
0
/2d. The slope of
the n vs pressure graph is therefore:
where
P
i
= the initial air pressure;
P
f
= the final air pressure;
n
i
= the index of refraction of air at pressure
P
i
; n
f
= the index of refraction of air at pressure
P
f
; N
= the number of fringe transitions counted during
evacuation;
λλλλλ
0
= the wavelength of the laser light in vacuum (see your instructor);
d
= the length of the vacuum cell (3.0 cm).
1.
Calculate the slope of the n vs pressure graph for air.
2.
On a separate piece of paper, draw the n vs pressure graph.
Questions
1.
From your graph, what is
n
atm
, the index of refraction for air at a pressure of 1 atmosphere (76 cm Hg).
2.
In this experiment, a linear relationship between pressure and index of refraction was assumed. How
might you test that assumption?
3.
The index of refraction for a gas depends on temperature as well as pressure. Describe an experiment
that would determine the temperature dependence of the index of refraction for air.
n i – nf
Pi – Pf
=
N
λ
0
2d(Pi – Pf)

