background image

- 28 -

 Service Manual


HV_Feedback Voltage (D08)

Procedure:
1.

Apply a NTSC all black pattern.

2.

Connect meter (+) to TPA38 and (-) to TPA20

3.

Adjust DAC D08 so that reading on meter is
5.0_V±0.2_V.

Sub-Bright Adjustment (B00)

Procedure:
1.

Set to normal picture settings.

2.

Connect meter (+) to TPA18 and (-) to TNPA19.

3.

Apply a black level pattern.

4.

Adjust DAC B00 (Sub-Brightness) so that reading
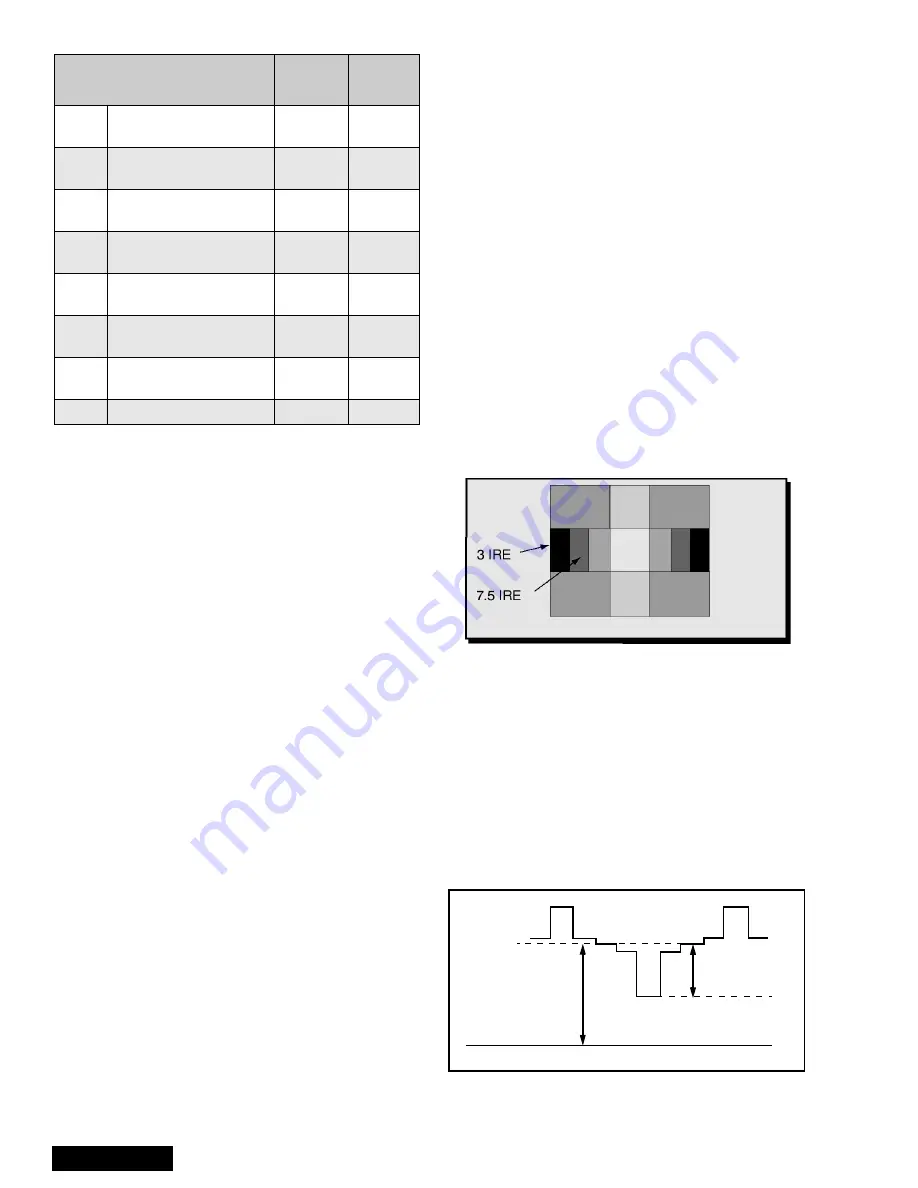
on meter is 17.0_V±1_V (7.5 IRE part is same light
output as 3 IRE part (See Figure 56).

5.

Apply a monoscope pattern and put bright control
to max. and confirm same reading on meter.

Contrast Adjustment

Preparation:
1.

Set Auto Color and AI Picture to OFF

2.

Set the following in the user picture menu as
follows:
COLOR: min. (0)
PICTURE: max (63)
BRIGHT: center (31)
SHARPNESS: min. (0)

Set  CutOff Data:

DAC C00 (R_CutOff) to 128.

DAC C01 (G_RF CutOff) to 128.

DAC C02 (B_CutOff) to 128.

DAC C06 (G_Video CutOff) to 127.

DAC C07 (B_Video CutOff) to 127.

DAC C0A (G_Video Component) to 127.

DAC C0B (B_Video Component) to 127.

Set Drive Data:

DAC C04 (

G_Drive RF) to 64.

DAC C05 (

B_Drive RF) to 64.

Procedure:

1.

Use 100:1 probe for measurements.

2.

Apply a Black/White Pattern (See Figure 56) 

3.

Connect Scope to TPLR1 and adjust Sub-Bright
(B00) data until voltage measured is 190V 

± 

2V.

See Figure 57.

4.

Connect Scope to TPLG1 and adjust R-CutOff
(C00) data until voltage measured is 190V

±

2V.

(See Figure 57).

5.

Connect Scope to TPLB1 and adjust B-CutOff
(C02) data until voltage measured is 190V

±

2V.

(See Figure 57).

6.

Connect Scope to TPLR1 and adjust Sub-Contrast
(B01) data to obtain 85V±2 V between black
(7.5 IRE) and White level (See Figure 57).

V0E

User Static Data
(Vertical, Blue)

FIXED

100

V0F

User Static Data
(Horizon, Red)

FIXED

100

V10

User Static Data
(Horizon, Green)

FIXED

100

V11

User Static Data
(Horizon, Blue)

FIXED

100

V12

Test Pattern Horizontal 
Phase (LOW)

FIXED

0 ~ 90

V13

Test Pattern Fine 
Horizontal Phase (LOW)

FIXED

4 ~ 100

V14

Test Pattern Coarse 
Horizontal Phase (LOW)

FIXED

0 ~ 0

V15

Start Line (LOW)

FIXED

0 ~ 11

 Service Adjustment

Adj.

Range

Default 

Level

Table 11: Service Adj. V00 ~ V15 (Continued)

Figure 56.  Black/white Pattern

Figure 57.  Contrast Adjustment.

GND

85V

±

2V (R)

190V

±

2V (R, G,B)

7.5 IRE

Use 100:1 Probe

Summary of Contents for PT51G36E - 51" PROJECTION TV

Page 1: ...e non technical individuals of potential dangers in attempting to service a product Products powered by electricity should be serviced or repaired only by experienced professional technicians Any atte...

Page 2: ...ture of each CRT Figure 24 Figure 22 D Focus Adjustment Waveform 5 Connect the scope probe to TPA16 GND to TPA17 Scope set at 20V div 5m sec div 6 Confirm that level of A is 550_V 100_V and B is 350_V...

Page 3: ...le magnet to 90 degrees uncorrected position See Figure 27 5 Position the long tab of all alignment magnets and of the dummy ring together in an uncorrected position See Figure 28 Procedure 1 Apply an...

Page 4: ...onvergence 4 Adjust centering magnets so that the center of pattern get aligned with screen frame center 5 Adjust DAC D00 V_Size until vertical size is 4 0 0 1 on top and bottom lines See Figure 30 6...

Page 5: ...tering magnets until the monoscope pattern center is at the appropriate distance as indicated on Figure 34 12 Enable digital convergence by changing DAC D0F from 1 to 0 13 Following the adjustment mak...

Page 6: ...te to switch between cursor mode and data mode Cursor mode Allows cursor movement by pressing VOL right left and CH up down Data mode Allows making adjustment by pressing VOL right left and CH up down...

Page 7: ...pressing CH up down See Figure 42 18 Press 7 then ACTION key on remote to save changes Figure 42 KEY mode adjustment Note Confirm that pattern looks like a square and almost overlaps the screen frame...

Page 8: ...ith green pattern 42 Press 7 key on remote then ACTION to save changes 43 Press POWER then ACTION to exit adjustments or press TV VIDEO for at least 3 seconds to change to Fine Adjustment Mode Fine Ad...

Page 9: ...r the non visible area inside the ovals area see Figure 48 This applies to POINT ORIGIN POINT modes 17 Begin adjustment from the center to the edge of the screen 18 Adjust to make lines as much straig...

Page 10: ...is 3 5 0 1 lines at C and D as indicated in Figure 52 Convergence Alignment Template The Convergence Alignment Template is a grid approximately the size of the viewing screen used to ensure the prope...

Page 11: ...Press Power on the Remote Control to select one of the Service Adjustment Modes 1 B Service VCJ SUB DATA ADJUSTMENTS 2 C Service VCJ CUT OFF ADJUSTMENTS 3 D Service PINCUSHION ADJUSTMENTS 4 P Service...

Page 12: ...o FIXED 15 B0B Sub Sharpness Component FIXED 20 B0C Sub Contrast Table 5 Service Adj B00 B0C Service Adjustment Adj Range Default Level C00 R Cutoff 0 255 128 C01 G Cutoff RF 0 255 128 C02 B Cutoff 0...

Page 13: ...7 S0B Caption Digital Filter SW FIXED 1 S0C Caption Scroll FIXED 1 S0D RGB MTX RF Video FIXED 6 S0E RGB MTX Component FIXED 5 S0F BBE ON OFF FIXED 1 S10 BBE Low Level FIXED 4 S11 BBE High Level FIXED...

Page 14: ...Set Drive Data DAC C04 G_Drive RF to 64 DAC C05 B_Drive RF to 64 Procedure 1 Use 100 1 probe for measurements 2 Apply a Black White Pattern See Figure 56 3 Connect Scope to TPLR1 and adjust Sub Bright...

Page 15: ...ve too much blue or green 6 Use a test signal from a VCR or laser disk that has a pre recorded close up of a signal that has good flesh tones 7 The signal on the VCR or laser disk should look normal C...

Page 16: ...frequency and record the reading Note Pin 34 measurement must have at least four digits of resolution following the decimal point Example 000 0000 3 Place the PTV into Service Mode for making electron...

Page 17: ...50 PT 51G36E EC A Board Schematic Left Portion...

Page 18: ...51 PT 51G36E EC A Board Schematic Waveforms WAVEFORMS IC451 Pin 2 67 2Vp p 1 V OUT A Board Q501 COLLECTOR 188Vp p 1 H DRIVE A Board...

Page 19: ...52 PT 51G36E EC P Board Schematic Left Portion...

Page 20: ...C833 1 2 3 7 85 0 00 4 89 P Board Voltage Measurements IC Transistors Q801 0 00 16 10 4 87 S D G IC802 1 2 3 141 20 10 38 0 00 IC832 1 2 3 11 47 0 00 8 86 Q802 0 71 0 10 0 00 IC801 1 2 3 4 5 6 7 8 9 1...

Page 21: ...54 PT 51G36E EC X Board Schematic Left Portion...

Page 22: ...15 3 92 4 94 2 32 2 55 0 00 IC101 1 2 3 4 5 6 7 8 9 10 11 12 13 14 15 16 17 18 19 20 21 22 23 24 25 26 27 28 4 14 0 00 3 37 3 36 3 36 0 00 8 56 0 00 5 16 0 00 7 55 4 54 2 51 2 49 2 56 8 71 4 93 4 79 4...

Page 23: ...58 PT 51G36E EC K G R Board Schematics Layouts K Board Schematic K Board Layout G Board Schematic G Board Layout R Board R Board Layout...

Page 24: ...urements Q960 9 54 71 30 8 97 B C E Q959 131 40 71 30 132 10 Q961 139 90 132 00 140 50 Q3391 3 21 11 48 2 98 Q3341 2 98 11 99 2 39 Q3342 2 32 0 00 2 92 B C E Q397 8 13 1 46 8 39 Q393 11 98 167 10 0 00...

Page 25: ...Q376 175 90 8 64 175 70 Q373 11 98 175 10 11 46 Q374 176 30 216 60 176 00 Q956 9 94 73 20 9 37 Q955 131 80 73 30 132 30 B C E Q941 0 98 9 38 0 39 Q937 6 84 0 00 7 46 Q938 140 00 132 30 140 50 Q935 7...

Page 26: ...1 98 173 20 11 45 Q354 174 50 217 20 174 10 Q3351 3 16 11 46 2 94 Q350 0 00 215 30 0 00 Q351 0 61 0 00 0 00 Q931 139 90 132 00 140 50 B C E Q932 0 97 9 08 0 37 Q957 131 40 71 70 132 10 Q958 9 65 71 70...

Page 27: ...5 36 37 38 39 40 41 42 43 44 45 46 47 48 49 50 51 52 3 23 3 23 0 00 0 00 0 00 0 62 0 14 3 23 3 23 0 00 2 32 1 45 2 84 1 29 0 99 0 00 0 98 3 23 0 99 3 23 1 03 0 00 1 00 0 00 0 98 0 00 Y Board Voltage M...

Reviews: