background image


User Manual of PDS Series Oscilloscope


 49


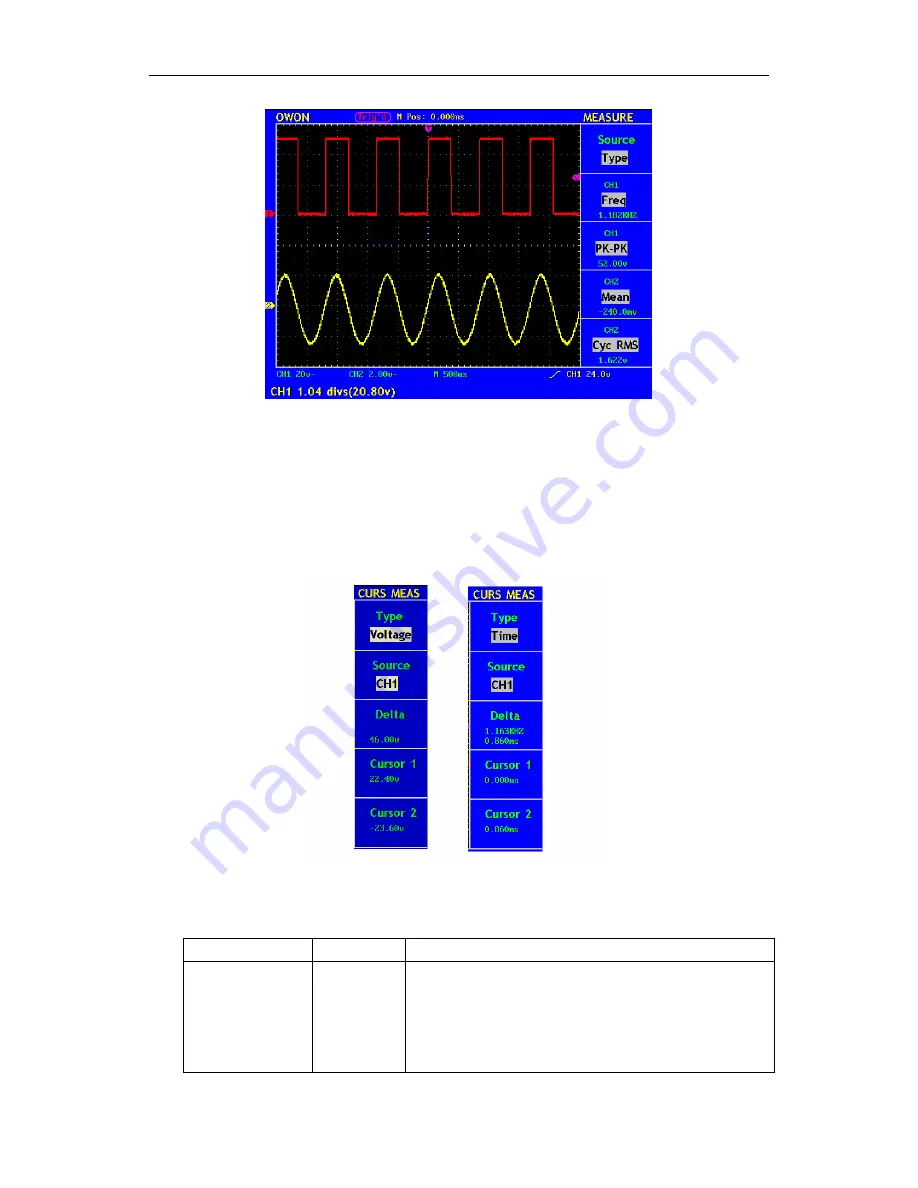
Fig.50

 Automatic Measurement   

To perform the Cursor Measurement   

Press 

CURSOR

 button on the front panel to activate cursor function menu-

 CURS 

MEAS 

on the screen, there are two types of cursors: Voltage and Time. 


Fig.51

 CURS MEAS Menu 

The description of the 

cursor measurement menu 

is shown as the following table:   

Function Menu   Setting 

Description  

Type 

OFF 

Voltage 


Time 

The cursor is off, no measurement taking.   
Turn on horizontal cursors and display their voltage 
value. 
Turn on vertical cursors and display their time 
value.  

Summary of Contents for PDS series

Page 1: ...PDS Series Portable LCD Digital Storage Oscilloscope User Manual PDS5022S PDS5022T PDS6042S PDS6062S www owon com cn www owon com hk ...

Page 2: ...r OWON will continue to improve products and reserves the rights to changes specification at any time without notice OWON is the registered trademark of the Lilliput Company Xiamen Lilliput Technology Co Ltd the 5th floor B Area Chuangxin Mansion Software Park ZhenZhuWan Huandao RD Xiamen Fujian China Tel 86 592 2575666 Fax 86 592 2575669 Web www owon com cn Mail sales owon com cn Fujian Lilliput ...

Page 3: ...e service center designated by Lilliput and with a copy of customer proof of purchase This warranty shall not apply to any defect failure or damage caused by improper use or improper or inadequate maintenance and care Lilliput shall not be obligated to furnish service under this warranty a to repair damage resulting from attempts by personnel other than Lilliput representatives to install repair o...

Page 4: ...ion 16 To set the Probe Attenuation Coefficient 17 To use the Probe Safely 18 To perform Self calibration 18 Introduction to the Vertical System 19 Introduction to the Horizontal System 20 Introduction to the Trigger System 21 Advanced User s Guidebook 22 To set the Vertical System 23 Perform Mathematical Manipulation Function 26 Using FFT function 26 Application of VERTICAL POSITION and VOLTS DIV...

Page 5: ...Start Guide 54 Example 1 Measuring a Simple Signal 54 Example 2 Working out the Gain of the Amplifier in the Metering Circuit 55 Example 3 Capture the Single Signal 56 Example 4 Analyze the Details of a Signal 57 Example 5 Examine the Phase shift between two related signals 59 Example 6 Video Signal Trigger 60 Troubleshooting 61 Appendix A Technical Specifications 62 Appendix B Package Contents 67...

Page 6: ...or output terminal When powered by AC power it is not allowed to measure AC power source directly because the testing ground and power cord ground conductor are connected together otherwise it will cause short circuit When powered by battery the product must ground connection To avoid electric shock there must be a ground wire connect between ground and the ground port on the back of product panel...

Page 7: ...esult in damage to this product or other property Terms on the product The following terms may appear on this product Danger It indicates an injury or hazard may immediately happen Warning It indicates an injury or hazard may be accessible potentially Caution It indicates a potential damage to the instrument or other property might occur Safety Symbols Symbols on the product The following symbol m...

Page 8: ...e oscilloscope ground wire connection It is not allowed to measure AC power when charging the oscilloscope with adapter Warning To avoid fire or electrical shock when the oscilloscope input signal connected is more than 42V peak 30Vrms or on circuits of more than 4800VA please take note of below items z Only use accessory insulated voltage probes and test lead z Check the accessories such as probe...

Page 9: ...on Color liquid crystal display of high resolution and high contrast Storage and recall waveforms Automatic setting function provided capable of fast setting Multiple waveform calculation function Built in FFT function Perform detecting the average and peak values of the waveform Real time Digital Oscilloscope Multiple triggering including Edge video and Alternating triggering RS232 or USB communi...

Page 10: ... interface of the PDS series oscilloscope z To perform the general inspection z To perform the function inspection z To perform the probe compensation z To set the probe attenuation coefficient z To use the probe safely z To perform an self calibration z Introduction to the vertical system z Introduction to the horizontal system z Introduction to the trigger system ...

Page 11: ...PDS series oscilloscope in the shortest time The PDS series oscilloscope offers a simple front panel with distinct functions to users for their completing some basic operations in which the knobs and function pushbuttons are included The knobs have the functions similar to other oscilloscopes The 5 buttons in the column on the right side of the display screen are menu selection buttons defined as ...

Page 12: ...cope 10 Fig 1 The Front Panel of a PDS series Oscilloscope Function Buttons Fig 2 Explanatory Drawing for Operations of the PDS series Oscilloscope Adjustment Menu Selection Vertical Control Connector Horizontal Control Trigger Control ...

Page 13: ...e captures and displays the waveform data continuously in the scan mode Stop The oscilloscope has already stopped the waveform data acquisition 2 Waveform Viewing Area 3 The purple pointer indicates the horizontal trigger position which can be adjusted by the horizontal position control knob 4 The reading shows the time deviation between the horizontal trigger position and the screen centre line w...

Page 14: ...tes GND coupling 16 The reading shows the vertical scale factor the Voltage Division of the CH2 channel 17 The icon indicates the coupling mode of the CH1 channel The icon indicates the direct current coupling The icon indicates the AC coupling The icon indicates GND coupling 18 The reading indicates the vertical scale factor the Voltage Division of the CH1 channel 19 The information shows the zer...

Page 15: ...You can check whether there is any loss of accessories with reference to this description If it is found that there is any accessory lost or damaged please get in touch with the distributor of LILLIPUT responsible for this service or the LILLIPUT s local offices 3 Check the Complete Instrument If it is found that there is damage to the appearance of the instrument or the instrument can not work no...

Page 16: ... UTILITY button to get access to the FUNCTION menu and push down F2 the menu selection button to call out the function Recall Factory The default attenuation coefficient set value of the probe in the menu is 10X shown as Fig 4 Fig 4 Power on the Instrument 2 Set the Switch in the Oscilloscope Probe as 10X and Connect the Oscilloscope with CH1 Channel Align the slot in the probe with the plug in th...

Page 17: ...e 15 Probe comp CH1 Fig 5 Connection of the Probe 3 Press the AUTO SET Button The square wave of 1 KHz frequency and 5V peak peak value will be displayed in several seconds see Fig 6 Fig 6 Auto set Check CH2 by repeating Step 2 and Step 3 ...

Page 18: ...probe in the menu as 10X and that of the switch in the probe as 10X and connect the oscilloscope probe with the CH1 channel If a probe hook tip is used ensure that it keeps in close touch with the probe Connect the probe tip with the signal connector of the probe compensator and connect the reference wire clamp with the ground wire connector of the probe connector and then press the button AUTOSET...

Page 19: ... is shown This setting will be valid all the time before it is changed again Note The attenuation coefficient of the probe in the menu is preset to 10X when the oscilloscope is delivered from the factory Make sure that the set value of the attenuation switch in the probe is the same as the menu selection of the probe in the oscilloscope The set values of the probe switch are 1X and 10X see Fig 9 F...

Page 20: ...ments please connect the probe to the instrument and connect the ground terminal to the earth To perform Self calibration The self calibration application can make the oscilloscope reach the optimum condition rapidly to obtain the most accurate measurement value You can carry out this application program at any time but when the range of variation of the ambient temperature is up to or over 5 this...

Page 21: ...measure the DC component of the signal through the observation of the difference between the wave form and the signal ground If the channel is under the AC mode the DC component will be removed by filtration This mode helps you display the AC component of the signal with a higher sensitivity 2 Change the Vertical Setting and Observe the Consequent State Information Change With the information disp...

Page 22: ... be found that the Horizontal Time Base display in the status bar changes accordingly The horizontal scanning speed steps from 5ns up to 100s according to the stepping mode of 1 2 5 5 PDS5022S T 1 2 5 PDS6042S PDS6062S 2 Use the HORIZONTAL POSITION knob to adjust the horizontal position of the signal in the waveform window The HORIZONTAL POSITION knob is used to control the triggering displacement...

Page 23: ... the LEVEL knob to change the trigger level setting With the rotation of the LEVEL knob it can found that the trigger indicator in the screen will move up and down with the rotation of the knob With the movement of the trigger indicator it can be observed that the trigger level value displayed in the screen changes 3 Press the button SET TO 50 to set the trigger level as the vertical mid point val...

Page 24: ... familiar with the above mentioned operations and methods yet we advise you to read the section of Chapter One Junior Users Guidebook This chapter will deal with the following topics mainly z To set the Vertical System z To set the Horizontal System z To set the Trigger System z To perform the Sampling Setup z To set the Display System z To Save and Recall a Wave Form z To perform the Auxiliary Sy...

Page 25: ... these function and settings Function Menu Setting Description Coupling AC DC Ground Block the DC component from input signal Pass both AC and DC components from input signal Input signal is interrupted Channel OFF ON Close the measurement channel Open the measuring channel Probe 1X 10X 100X 1000X Choose one according to the probe attenuation factor to make the vertical scale reading accurate Fig ...

Page 26: ...icient of the probe it is required to adjust the attenuation ration coefficient of the probe through the operating menu of the Channel accordingly If the attenuation coefficient of the probe is 1 1 that of the oscilloscope input channel should also be set to 1X to avoid any errors presented in the displayed scale factor information and the measured data Take the Channel 1 as an example the attenua...

Page 27: ...layed signal is turned 180 degrees against the phase of the earth potential Taking the Channel 1 for example the operation steps are shown as follows 1 Press the CH1 MENU button and get access to the CH1 SETUP menu 2 Press the F4 menu selection button and select ON in the Inverted The wave form inverted function is initiated 3 Press the F4 menu selection button again and select OFF for Inverted it...

Page 28: ... wave form M is displayed in the screen press the F3 menu selection button again the wave form M is closed off see Fig 20 Fig 20 Wave Form resulted from CH1 CH2 Mathematical Manipulation The corresponding FCL Functional Capabilities List of the Wave Form Calculation Setting Description CH1 CH2 Subtract the Channel 2 wave form from the Channel 1 wave form CH2 CH1 Subtract the Channel 1 wave form fr...

Page 29: ...CH2 as FFT source Window Rectangle Blackman Hanning Hamming Select window for FFT Format dB Vrms Select dB for Format Select Vrms for Format Zoom 1 2 5 10 Set multiple 1 Set multiple 2 Set multiple 5 Set multiple 10 Taking the FFT operation for example the operation steps are as follows 1 Press F1 once to turn on FFT Press again to turn it off Be aware that only to use FFT when Horizontal Menu is ...

Page 30: ...uring the frequency spectrum of nonrepetitive signals and measuring frequency components near DC Use rectangle for measuring transients or bursts where the signal level before and after the event are nearly equal Also use this window for equal amplitude sine waves with frequencies that are very close and for broadband random noise with a relatively slow varying spectrum Hamming This is a very good...

Page 31: ...w Fig 23 Rectangle window Fig 24 Hanning window Quick Tips If desired use the zoom feature to magnify the FFT waveform Use the default dBV RMS scale to see a detailed view of multiple frequencies even if they have very different amplitudes Use the linear RMS scale to see an overall view of how all frequencies compare to each other Signals that have a DC component or offset can cause incorrect FFT ...

Page 32: ...gger control SET 50 5 Auto scale function Application of VERTICAL POSITION and VOLTS DIV Knobs 1 The VERTIVAL POSITION knob is used to adjust the vertical positions of the wave forms of all Channels including those resulted from the mathematical operation The analytic resolution of this control knob changes with the vertical division 2 The VOLTS DIV knob is used to regulate the vertical resolution...

Page 33: ...pulation the analytic resolution of which changes with the time base 2 SEC DIV knob it is used to set the horizontal scale factor for setting the main time base or the window 3 HORIZONTAL MENU button Press this button to active TIME MODE shown as below with description of each function see Fig 26 Fig 26 Time Mode Function Menu Setting Description Main Time Base The setting of the horizontal main t...

Page 34: ...o adjust the main window The display in the screen is shown as Fig 27 Fig 27 Main Time Base Window Setting Press the F2 menu selection button and choose Set Window The screen will show a window area defined by two cursors In this case the HORIZONTAL POSITION and SEC DIV knobs can be used to adjust the horizontal position and size of this window area see Fig 28 Fig 28 Set Window Zoom in ...

Page 35: ...perform the data acquisition while waiting for the trigger condition After a trigger is detected the oscilloscope will continuously collect data enough to draw the wave form at the right side of the trigger point One knob and four function menu buttons are included in the trigger control zone TRIG LEVEL Trigger the level control knob and set the signal voltage corresponding to the trigger point SE...

Page 36: ...pectively as below Edge Trigger Under the Edge Trigger mode a trigger happens in the trigger threshold value of the input signal edge When the Edge Trigger is selected a trigger will occur in the rising or falling edge of the input signal The Edge Trigger Menu is shown as Fig 30 Fig 30 Edge Trigger Menu The Edge Trigger Menu is described as below Function Menu Setting Description Source CH1 CH2 EX...

Page 37: ...fore the oscilloscope responses to next trigger signal During this Holdoff period the trigger system becomes blind to trigger signals This function helps to view complex signals such as an AM waveform Press Function next to Holdoff to activate and use TRIG LEVEL knob to set time for Holdoff Set up a Rising Falling for edge trigger Applying Sine Waveform to CH1 1 Press the TRIG MENU button c the tr...

Page 38: ... return to previous menu 10 Press F3 next to Slope to choose Falling option see Fig 32 Fig 32 Waveform when Triggered on Falling Edge Video Trigger After choosing Video Trigger a trigger is possible in field or line of NTSC PAL or SECAM standard video signal The operation menu of Video Trigger is shown as Fig 33 ...

Page 39: ... the line of input video signal Trigger the time base on the field of input video signal Trigger the odd fields of input video signal Trigger the even fields of input video signal Trigger the time base on chosen line of input video signal Modulation NTSC PAL SECAM Format of video signal Move to next submenu Back to previous menu HoldOff 100ns 10s Set interval by using TRIG LEVEL control value rang...

Page 40: ...quire the waveform till it is triggered When there is not any trigger the oscilloscope will display the origin waveform without new waveforms captured Single shot mode In this mode the oscilloscope will detect a trigger and capture a waveform at each time when the customer presses the RUN STOP key Sensitivity Trigger circuit including sluggish in order to exclude the influences from signal noise a...

Page 41: ... Fig 35 ACQU MODE Menu Here is an example for using Peak Detect function the input is a standard test square waveform You can see the burrs on the falling edge of signal is detected with noise when it is turned on Fig 36 Peak Detect mode Function Menu Setting Description Sample Normal sampling mode Peak Detect Use to capture maximal and minimal samples Finding highest and lowest points over adjace...

Page 42: ...d Fig 41 show waveform in different type Function Menu Setting Description Type Vectors Dots The adjacent sampling points are joined by vector form Only displaying sampling points captured Persist OFF 1sec 2sec 5sec Infinite Options for setting the persistence time for each sampling point Format YT XY Show waveform as voltage against time Show waveform as CH1 X against CH2 Y Carry Bitmap Vectors T...

Page 43: ...When the Infinite option is set for Persist time the measuring points will be stored till the controlling value is changed see Fig 42 Fig 42 Infinite Persistence Display XY Format This format is only applicable to Channel 1 and Channel 2 After the XY display format is selected Channel 1 is displayed in the horizontal axis and Channel 2 in the vertical axis the oscilloscope is set in the untriggere...

Page 44: ...base controls All Trigger controls Use XY Format 1 Apply input signals to both CH1 and CH2 2 Press the DISPLAY to activate DISP Set menu 3 Press F1 to set Vectors as type F2 to set Infinite for persist and F3 to set XY as Format as shown as Fig 43 Fig 43 Display in XY Format To Save and Recall a Waveform Our PDS series Digital Oscilloscope is capable to save up to four wave forms Stores waveform c...

Page 45: ...d waveform would be overwritten by the new one To recall a stored waveform activate WAVE SAVE menu z Press F2 next to Wave to select from one of four locations the CH X would show the location you ve chosen z Press F4 next to CH X to change to ON Now you will see a stored waveform displayed on the screen with whatever waveforms are already on there z Example to save recall a waveform from location...

Page 46: ...cope under ambient temperature It is recommended to carry a self Calibration if the change of the ambient temperature is up to or exceeds 5 Notes Disconnect all inputs before carrying out a self calibration Fail to do so may cause damage to your oscilloscope Function Menu Setting Description System Status Display the system function menu Recall Factory Reset system settings to factory default Do S...

Page 47: ...tate Press the F1 menu selection button and choose SYS STAT item The menu pops up in the screen as Fig 47 Fig 47 SYS STAT Menu After entering into the SYS STAT menu choose the corresponding function with the corresponding parameters shown in the screen If press the F1 menu selection button and choose the function item Horizontal the Horizontal System State will be displayed in the screen Press any...

Page 48: ...ot mean square value Vmax Vmin Vtop Vbase Vamp Overshoot Preshoot RiseTime Fall Time Width Width Duty Duty DelayA B and DelayA B To use Measure simply Press Measure button would activate MEASURE menu Press F1 next to Source Type to allow you to switch between Source and Type Source is the signal from the channel which user to carry out a measurement and Type is one of the 20 measurements user want...

Page 49: ... Vbase Voltage of the waveform s flat base useful for square pulse waveforms Overshoot Defined as Vmax Vtop Vamp useful for square and pulse waveforms Preshoot Defined as Vmin Vbase Vamp useful for square and pulse waveforms Average The arithmetic mean over the entire waveform Vrms The true Root Mean Square voltage over the entire waveform Rise Time Time that the leading edge of the first pulse in...

Page 50: ...XY or SCAN format In this example we apply square wave to Channel 1 and sine wave to Channel 2 and we want to measure the frequency Peak to Peak value of Channel 1 and mean value and RMS value for Channel 2 Here is how we set them up z Press MEASURE to active MEASURE MENU z Press F1 next to Source Type to highlight Source z Press F2 to choose first sources as CH1 z Press F3 to choose second source...

Page 51: ...URS MEAS on the screen there are two types of cursors Voltage and Time Fig 51 CURS MEAS Menu The description of the cursor measurement menu is shown as the following table Function Menu Setting Description Type OFF Voltage Time The cursor is off no measurement taking Turn on horizontal cursors and display their voltage value Turn on vertical cursors and display their time value ...

Page 52: ...SOR 2 Now we take you through two examples to set up and use cursors for Voltage and Time measurements respectively An input signal of waveform is used throughout this example Voltage Cursor measurement z Press CURSOR to activate CURS MEAS menu z Press F1 to select Voltage and Type there are two purple horizontal lines appeared on the screen representing CURSOR 1 on the top and CURSOR2 on the bott...

Page 53: ...gger mode Division for voltage and Time scale based on the type of the signal the Amplitude of signal and Frequency of the signal Function Menu Setting Instruction Autoscale OFF ON Turn off Autoscale Turn on Autoscale Mode Vertical Horizontal HORI VERT Only adjust vertical scale according to input signal Only adjust horizontal scale according to input signal Adjust both vertical and horizontal sca...

Page 54: ...er of the screen when trying to change submenus of Trigger controls 3 If the display mode is in XY and STOP is turned on pressing AUTO SET to enter into Autoscale The oscilloscope will be set to YT mode and ATUO triggering 4 Oscilloscope is set as DC coupling with AUTO Triggering A warning message is displayed when trying to change these settings 5 The oscilloscope will turn off Autoscale if user ...

Page 55: ... Acquisition Mode Current Vertical Coupling DC Vertical Scale Adjust to the proper division Bandwidth Full Horizontal Level Middle Horizontal Sale Adjust to the proper division Trigger Type Current Trigger Source Show the minimum number of channels Trigger Coupling Current Trigger Slope Current Trigger Level Mid point Setting Trigger Mode Auto Display Format YT RUN STOP Enable or disable sampling ...

Page 56: ... to the signal source Step 3 Press AUTOSET button to let oscilloscope run through a pre set functions and apply them to incoming signal Step 4 Take the measurements by going through these settings 1 Press MEASURE to activate measurement function menu 2 Press F1 next to Source to highlight Source 3 Press F2 F3 F4 and F5 one by one to set them to CH1 4 Press F1 again and highlight Type 5 Press F2 an...

Page 57: ...u and then their Probe menu to set attenuation coefficient as 10X turn the switch on the Probe to 10X as well Step 2 Connect the Probe through Channel 1 to the signal source the input signal in the circuit And Probe 2 through Channel 2 to its signal source the output signal in the circuit Step 3 Press AUTOSET button to let oscilloscope run through a pre set function and apply them to both signals ...

Page 58: ...wledge of this signal For example if the pulse is the logic signal of a TTL level the trigger level should be set to 2 volts and the trigger edge be set as the rising edge trigger If it is uncertain as to the signal you can make an observation of it in advance under the automatic or ordinary mode to determine the trigger level and the trigger edge The operation steps are as follows 1 Set the probe...

Page 59: ...ng the burst burr of larger amplitude for example set the trigger level to the value just greater than the normal signal level and then press the RUN STOP button and wait When there is a burr occurring the instrument will trigger automatically and record the wave form generated during the period around the trigger time With the HORIZONTAL POSITION knob in the horizontal control area in the panel r...

Page 60: ... the important thing is to reduce the noise level as lower as possible this would enable user to have more details about the signal The Average function offered by our Oscilloscope can help you to achieve this Here are the steps for how to enable Average function 1 Apply square waveform to CH1 as a source signal Press ACQUIRE button to bring up ACQU MODE menu 2 Press F3 selection Average Press F4 ...

Page 61: ...s signals 1 Set up attenuation coefficient to 10X through Probe menu for both CH1 and CH2 Switch Probes to 10X For source signals CH1 takes in input signal to the circuit and CH2 takes in output signal from circuit 2 Press AUTOSET adjust VOLTS DIV for both CH1 and CH2 to the same amplitude level to get an ellipse 3 Press DISPLAY to activate DISP SET menu then F3 to select XY mode Now the waveform ...

Page 62: ...t signal display For the trigger in the video field carry out operations according to the following steps 1 Press the TRIG MENU button to display the trigger menu 2 Press the F1 menu selection button and choose Video for Type 3 Press the F2 menu selection button and choose CH1 for Source 4 Press the F3 menu selection button and choose Field for Sync 5 Adjust the VOLTS DIV VERTICAL POSITION and SEC...

Page 63: ...he signal acquisition operation again 3 The measured voltage amplitude value is 10 times greater or smaller than the actual value Check whether the channel attenuation coefficient and the attenuation ration of the probe used in practical application is match 4 There is wave form displayed but it is not stable z Check whether the Source item in the TRIG MODE menu is in conformity with the signal ch...

Page 64: ...alibration procedure All specification standards can be fulfilled except one s marked with the word Typical Characteristic Instruction Bandwidth 25MHz PDS5022S T 40MHz PDS6042S 60MHz PDS6062S Channel 2 1 External Mode Normal Peak detect Averaging Acquisition Sample rate real time 100MS s PDS5022S T 250MS s PDS6042S PDS6062S Input coupling DC AC Ground Input impedance 1MΩ 2 in parallel with 20pF 5p...

Page 65: ...le bandwidth Full bandwidth Low Frequency 5Hz at input AC coupling 3dB Rise time at input Typical 14ns PDS5022S T 8 75ns PDS6042S 5 8ns PDS6062S DC accuracy 3 Vertical system DC accuracy average The voltage difference V between any two points on the wave form after averaging the captured wave forms of more than 16 5 Reading 0 05 divisions Edge Rising Falling Type Video Line synchronization Field s...

Page 66: ...V Trigger sensitivity Video trigger typical EXT 5 2V Signal system NTSC PAL SECAM any frequency CH1 trigger Edge Video Alternate trigger CH2 trigger Edge Video Cursor V and T between cursors Automatic Peak to peak value average value root mean square value frequency period Vmax Vmin Vtop Vbase Vamp Overshoot Preshoot RiseTime Fall Time Width Width Duty Duty DelayA B and DelayA B Waveform Math Inve...

Page 67: ...o peak value 1MΩ Frequency typical 1KHz square wave Power Supply 100 240 VACRMS 50 60Hz CAT II Consumption 15W Fuse 2A T class 250V Battery Optional Environment Temperature Working temperature 0 40 Storage temperature 20 60 Relative Humidity 90 Height Operating 3 000 m Non operating 15 000 m Cooling Method Natural convection Mechanical Specifications Model PDS5022S T PDS6042S PDS6062S Weight 1 6kg...

Page 68: ...ptimize circuits that affect channel sensitivity offset and trigger parameters Let the instrument to warm up for at least 30 minutes before performing self calibration You should perform self calibration according to the following recommendations Every 12 months or after 2000 hours of operation If the ambient temperature is 10 C from the calibration temperature If you want to maximize the measurem...

Page 69: ...eck the probe and instrument regularly according to their operating state Clean the external surface of the instrument following the steps what shown as below 1 Please wipe the dust from the instrument and probe surface with a soft cloth Do not make any scuffing on the transparent LCD protection screen when clean the LCD screen 2 Clean the instrument with a wet soft cloth not dripping water during...

Page 70: ...power indication show on the top of panel when oscilloscope power supplied by the battery and imply for different power consumption and when shows it means the power can only supply for 5 minutes maximum Note To avoid superheat of battery during charging the environment temperature is not allowed to exceed the permissible value given in technical specification Replacing the Lithium Battery Unit It...

Reviews: