


SPS1M
−
EVK
3
♦
AutoPw RSSI
: Sets the minimum and maximum
target values for the AutoPower feature. See
Section 2.6.
♦
Max Power
: Sets the maximum power level the unit
will use.
Larger numbers correspond to lower
powers.
♦
Display
: Sets the output type to be displayed when
the read completes. See Section 2.5.
•
Checkboxes
♦
Autopower
: Activates the AutoPower function. See
Section 2.6.
♦
Dashboard
: Replaces the logo with the Dashboard
which provides more detailed information about the
result of a sensor tag read. See Section 2.7.
♦
High Precision
: Activates High Precision mode. In
this mode, the unit will make 30 read attempts
before displaying the results. This mode is
recommended for temperature measurements and for
Sensor Code measurements when precise values are
desired. When turned off, 10 reads are attempted.
♦
Fast
: Activates Fast mode. This mode will display a
result as quickly as possible, at the cost of lower
precision.
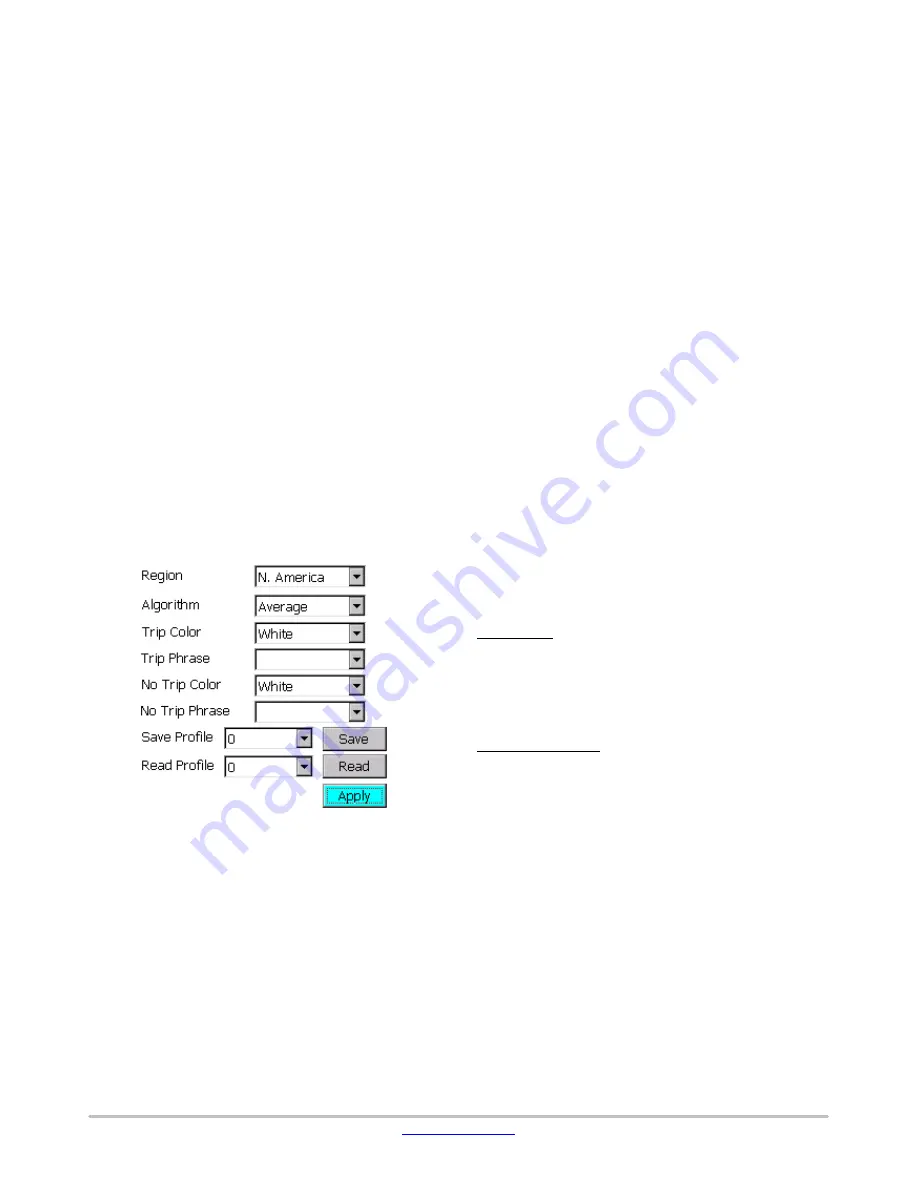
The Advanced screen is shown in Figure 6
Figure 6. Advanced Screen
The following controls are available:
•
Pulldowns
♦
Region
: Sets the RFID frequency band to use.
Setting to a band not corresponding to the reader
hardware will result in reduced performance.
♦
Algorithm
: Sensor Code values generally vary
linearly with the frequency channel on which they
are read. This pulldown selects whether the final
result will be the average of the individual reads, or
will be computed by performing a linear regression
analysis on the data. See Application Note AN006
for more information.
♦
Trip Color
: If the Sensor Code result is below the
trip value defined in the Setup screen, the result will
displayed with this background color.
♦
Trip Phrase
: If the Sensor Code result is below the
trip value defined in the Setup screen, this phrase
will be displayed.
♦
No Trip Color
: If the Sensor Code result is above
the trip value defined in the Setup screen, the result
will displayed with this background color.
♦
No Trip Phrase
: If the Sensor Code result is above
the trip value defined in the Setup screen, this phrase
will be displayed.
♦
Save Profile
: Settings can be saved to one of five
profiles, which will be stored on text files in Flash
memory. This pulldown selects the profile number to
be saved to.
Any settings saved to profile 0 will be
loaded automatically when the application is
launched.
♦
Read Profile
: Selects the stored settings profile
number to be read from.
•
Buttons
♦
Save
: Save settings to the selected profile number
♦
Read
: Load settings from the selected profile
number
♦
Apply
: Applies any changed settings and returns to
the Setup screen
Result Types
The unit can display three different types of results: the
Sensor Code
,
temperature
,
and the On
-
Chip RSSI Code
.
Sensor Code
The Sensor Code is a value between 0 and 31 for
Magnus
−
S2 tags, and between 0 and 511 for Magnus
−
S3
tags. It varies depending on the environment of the tag and
can be used to sense multiple quantities depending on the
design of the tag antenna
.
On
-
Chip RSSI Code
The On
−
Chip RSSI Code is a value between 0 and 31
which indicates how much power the tag is receiving from
the reader (higher values indicate more power). The
On
−
Chip RSSI code is used by the AutoPower function to
control the amount of power the unit transmits to the tag
.
Temperature
The unit can read the temperature code from the tag and
convert it to a value in degrees C or F. To perform the
conversion
,
the unit automatically reads temperature
calibration information stored in the Magnus
−
S chip
.
Only
Magnus
−
S3 tags support temperature measurements
.
AutoPower and On
-
Chip RSSI
Sensor and temperature results can be distorted if the
sensor tag receives high levels of power from the reader (see
Application Note AN006 for more information). Because of
this, the reader transmit power should be reduced if the


