


OLIMEX© 2012
OLinuXino User's Manual
6.1.1 UART debug
The first one is a debug UART interface – U_DEBUG. You can use our USB-SERIAL-CABLE
for debugging via the UART.
Note on how to use the U_DEBUG with USB-SERIAL-CABLE-F which has
RED GREEN
BLUE wires GND=BLUE, RX(INPUT)=GREEN, TX(OUTPUT)=RED.
Y
ou have to connect
to OLinuXino-MAXI U_DEBUG connector in this sequence:
BLUE wire to pin.3 (GND)
GREEN wire to pin.2 (TX)
RED wire to pin.1 (RX)
The baud rate for serial communication is 115 200.
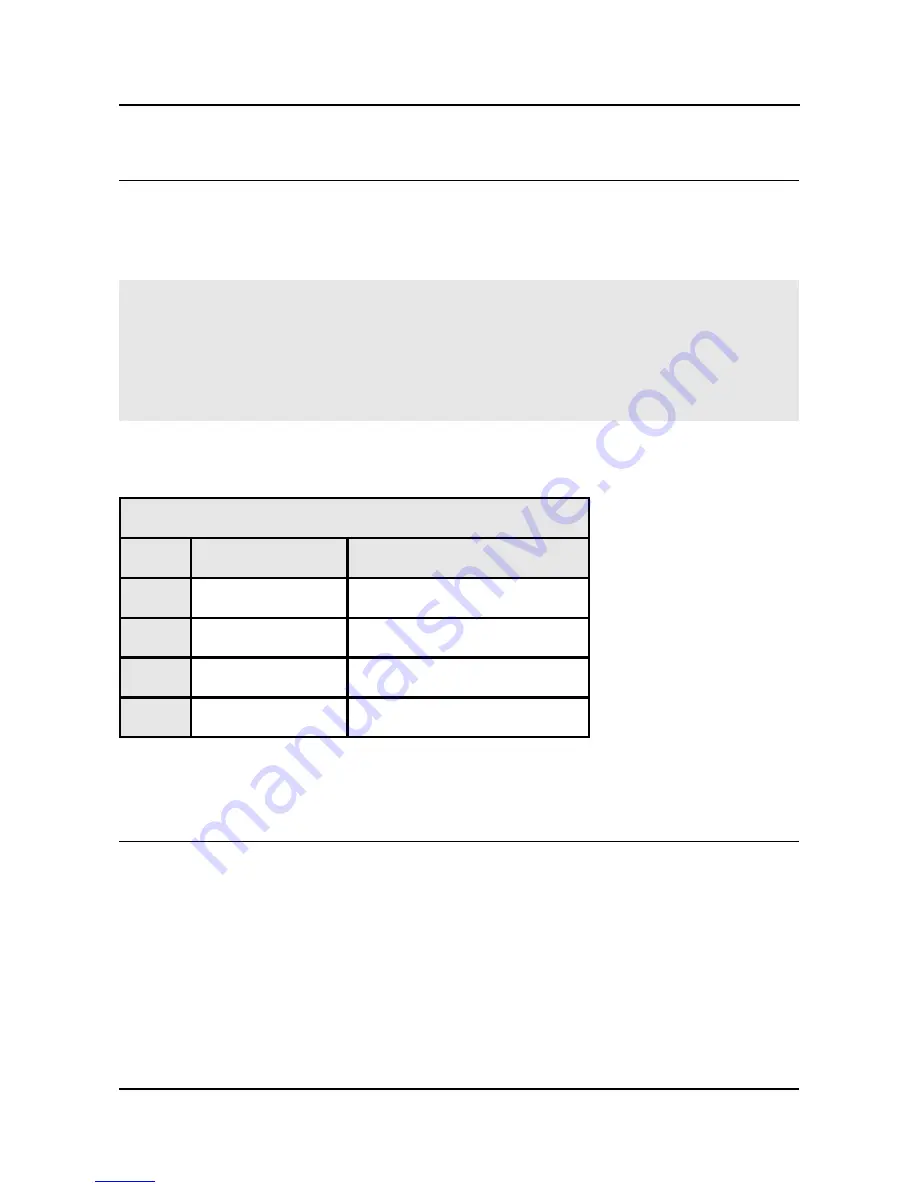
U_DEBUG
Pin # Signal Name
Processor Pin #
1
PWM0/DUART_RXD
125
2
PWM1/DUART_TXD
126
3
GND
30, 35, 98, 105, 112, 118
4
DEBUG
84
You can also check the pin names at the bottom of the board under the U_DEBUG header.
6.1.2 SJTAG debug
The second interface is the Serial JTAG (SJTAG) one-wire interface. It works with various external
JTAG debugger dongles through a Freescale-defined FPGA/CPLD. SJTAG supports the Green
Hills Slingshot and ETM probe debugger dongles, as well as those made by ARM, Abatron, and
Lauterbach.
Note that the SJTAG interface comes without plastic header mounted.
The HW_DIGCTL_CTRL_USE_SERIAL_JTAG bit in the digital control block selects whether the
one-wire serial JTAG interface or the alternative six-wire parallel JTAG interface is used. There are
Page 24 of 48
electronic components distributor


