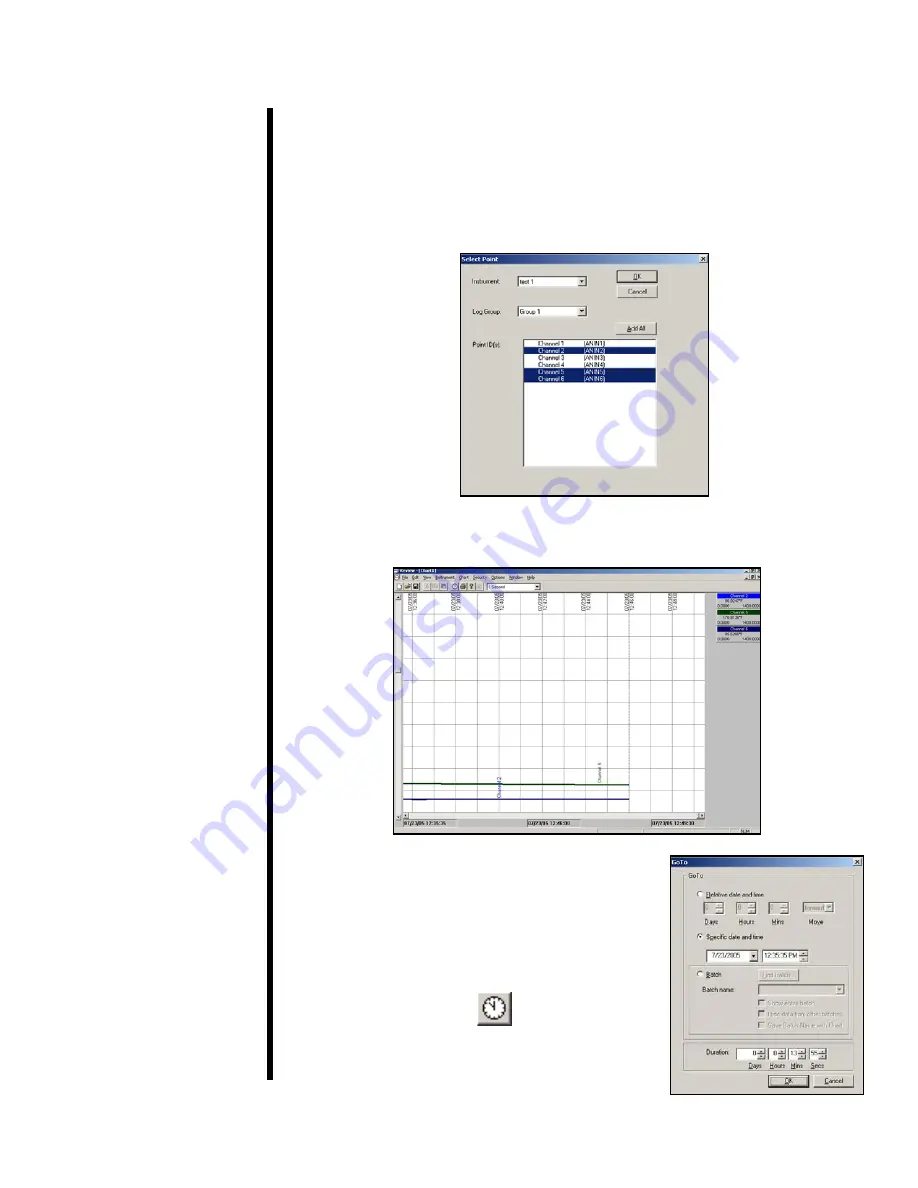
9. From the “Instrument” drop-down menu, choose the name you selected
in step 6.
10. Choose “Group 1” from the “Log Group” menu.
11. Now, select the Point IDs you wish to display on the chart. Hold down
the “CTRL” button to select more than one. Click “OK”.
12. The software will now create the chart based on the data collected from
the test.
13. To jump directly to a specific data point,
click the “Go To” button at the top of the
screen. Choose the data point you wish
to view and click “OK”.
OFITE, 11302 Steeplecrest Dr., Houston, TX 77065 USA / Tel: 832-320-7300 / Fax: 713-880-9886 / www.ofite.com
13
Go To


