OCS-BBI Reporter
2006 OCS, Inc.
Page 4-8
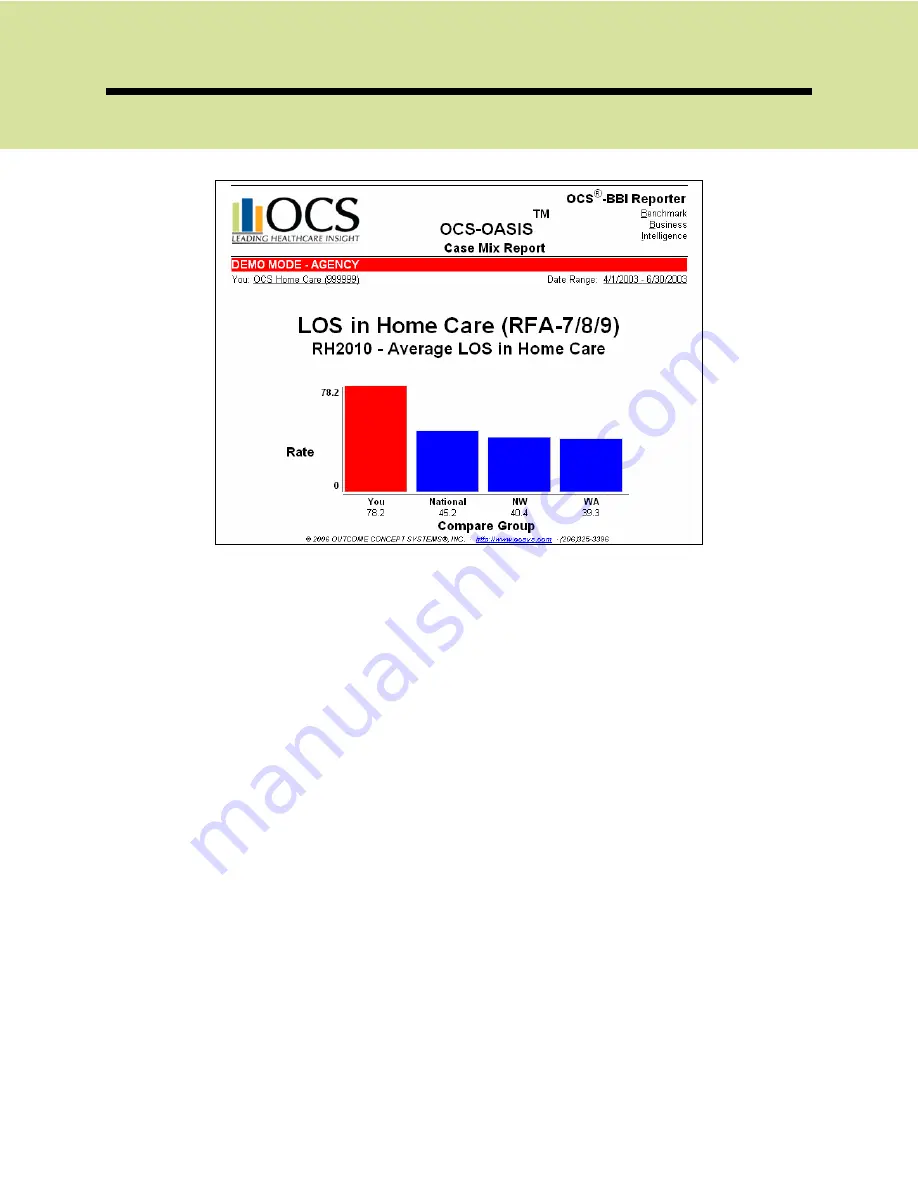
The
Online Graph
appears.
The data for your agency is displayed in red, while the norms that you selected
to display on your report are shown in blue. To return to your report and graph a
different measure, simply select [
Back
] on your browser window.
To exit Online Benchmarking, select F
ILE
|C
LOSE
from the menu bar.


