TISSUE LOADING BAR GRAPH
TISSUE LOADING BAR GRAPH
•
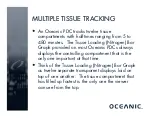
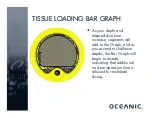
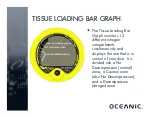
The Nitrogen Tissue
Loading Bar Graph
represents tissue loading
of nitrogen, showing your
relative no decompression
or decompression status.
•
The Tissue Loading
(Nitrogen) Bar Graph
offers you a convenient
way to consistently
monitor how close you
are coming to the No
Decompression Limit.
Summary of Contents for ATOM 2.0
Page 1: ......
Page 5: ...COMPUTERS vs TABLES COMPUTERS vs TABLES ...
Page 7: ...COMPUTERS vs TABLES COMPUTERS vs TABLES ...
Page 15: ...Diving with the VEO 100 Nx Diving with the VEO 100 Nx ...
Page 73: ...PRE PRE DIVE PLANNING DIVE PLANNING OBJECTIVES Perform pre dive planning ...
Page 166: ......


