


V0.2
Page 7
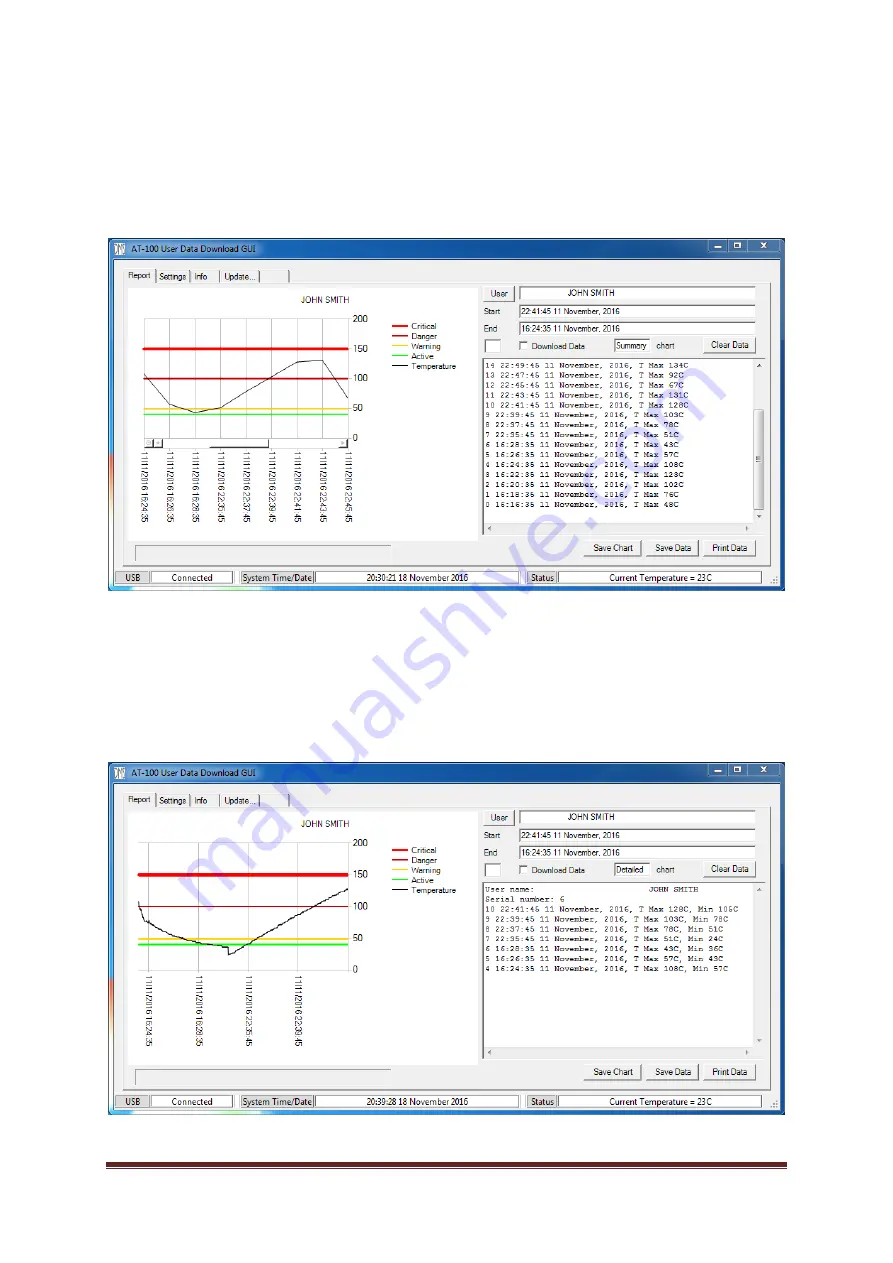
You can zoom in to select any particular region of interest on the chart. Move the cursor into the
chart area and position it over the start or end of the region you wish to inspect. Click and hold the
left mouse button, drag the cursor to the other end of the region of interest, and release the left
mouse button. The chart will zoom to show this area, and the “Start” and “End” boxes will show the
selected start and end dates/times.
Now select “Download Data” again. The chart and data windows will clear, “Detailed” will appear
next to “chart” to indicate the chart type is now detailed. The complete data record for the selected
period will be transferred from the device, and the text window will show block reference, start date
and time, and both maximum and minimum temperatures for each 2-minute block. The chart will
update to show full temperature details at one point per second. Left click “OK” when the “Data
download complete” message box appears again.


