


V0.2
Page 6
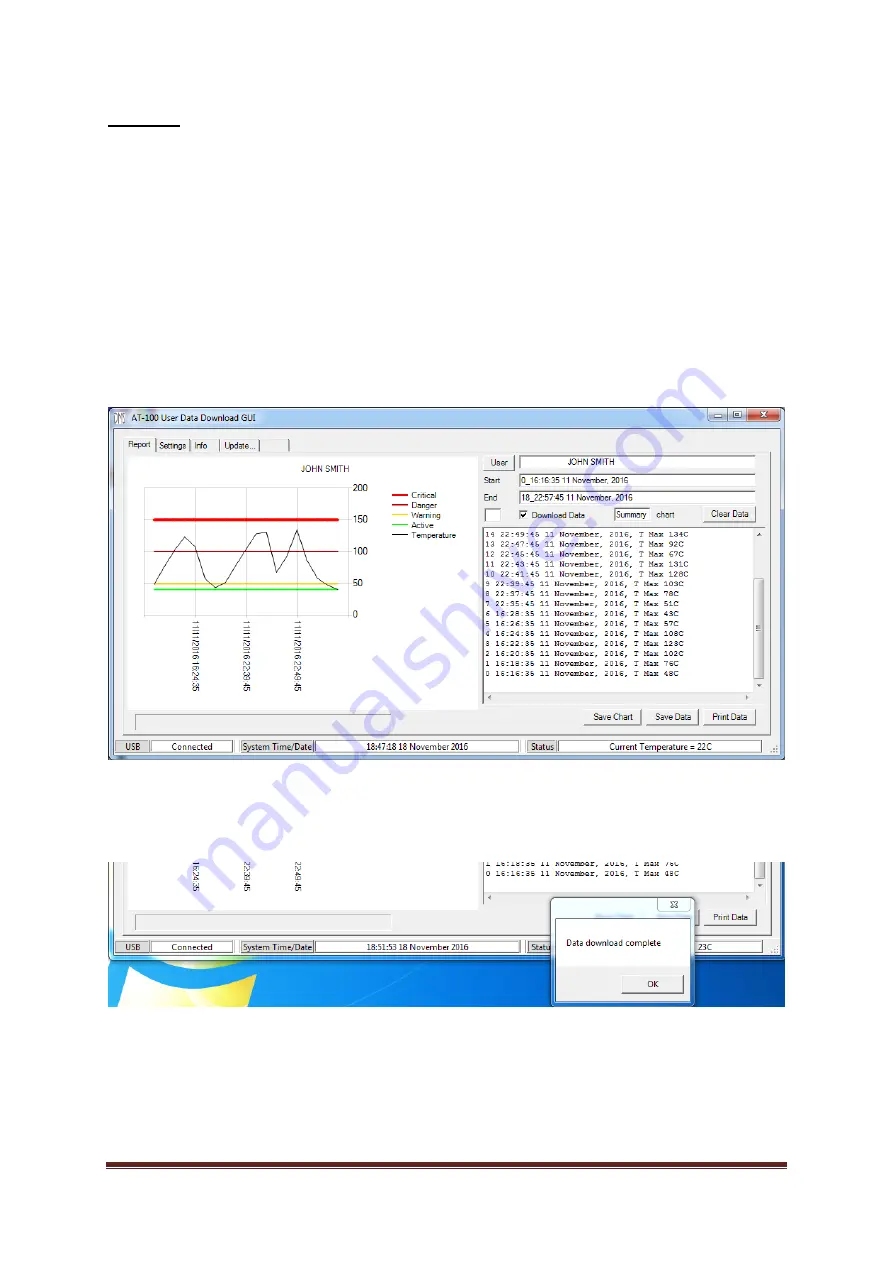
Report tab
The report tab is used for downloading recorded temperature data from the device, and provides a
graphical display as well as a text summary.
Select the “Download Data” checkbox. “Summary” will appear next to “chart” to indicate the chart
and data type being transferred. The device user name will appear in the User box, the text window
and the chart, and the serial number will appear in the text window. Summary date, time and
temperature data will be transferred from the device, starting with the most recent records and
proceeding to older records so that the latest data are readily accessible. As the transfer progresses,
2-minute blocks of data are summarised by block reference, start date and time, and maximum
temperature in the right-hand (text) window. After a short delay, the maximum temperature,
thresholds and date/time are plotted on the chart.
When the desired date/time range has been displayed in the text window, left click the “Download
data” checkbox again to terminate the transfer. Left click “OK” when a message box appears
showing “Data download complete”.
The AT-100 records data in 2-minute blocks. Please note that in its default configuration, 2-minute
data blocks are only recorded if they contain at least one temperature record exceeding the active
threshold. This causes gaps in the date/time information (when the temperature was too low to
record) but compresses the data for faster and more efficient transfer.


