FISH 4100 Installation and Operation Manual
NAVMAN
11
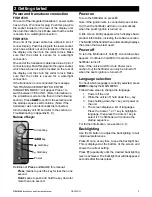
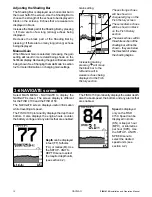
Select MAIN MENU - ZOOM to display the ZOOM
screen.
The ZOOM screen is split into two parts. On the right
is the full range section (just like the HISTORY
screen) and on the left is the zoom section.
Full range section
Zoom section
Zoom bar
The full range section illustrated is 42.75 m (150 ft)
and the zoom bar, located on the right edge of the
screen, shows the area that is enlarged in the zoom
section, in this case the section between 18.6 m and
27.7 m (61 ft and 91 ft).
The zoom section shows the area of interest (such
as fish or features close to the bottom) in greater
detail than the HISTORY screen.
Bottom Lock
The zoom bar is normally locked to the bottom
(Bottom Lock) so that the bottom is always displayed
in the zoom section, regardless of changes in depth.
To turn Bottom Lock off, press then move the zoom
bar to the desired position with or .
To turn Bottom Lock on, move the zoom bar down
until it touches the bottom and the message
“BOTTOM LOCK ON” briefly appears.
If Bottom Lock is off and the bottom rises to meet the
zoom bar, the zoom bar will temporarily track the
bottom. This condition will cease when the depth
exceeds the original depth of the zoom bar.
Changing the Zoom
To increase magnification (make the zoom bar
smaller), press . To decrease magnification (make
the zoom bar bigger), press .
Alternatively, the zoom bar can be adjusted in the
HISTORY screen before switching to the ZOOM screen.
3-4 ZOOM screen
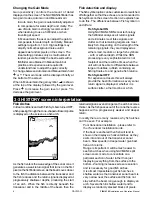
Select MAIN MENU - SONAR to display the SONAR
screen.
This is a powerful feature and with some experience,
this screen can be used to identify both the type of
bottom and the fish species.
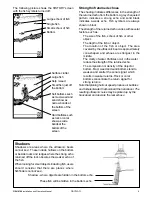
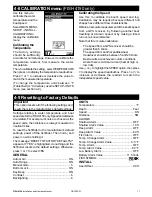
On the Sonar Echo section on the right side, the
strength of an echo at a particular depth is shown by
a horizontal line at that depth. A strong echo produces
a long line, whereas a weak echo produces a short
line. Below the echoes the screen shows the Shading
Bar.
The left side of the screen is the Fish History section.
Using the Shading Bar as a control, the fishfinder
interprets the echoes shown on the Sonar Echo
section and uses this information to draw the Fish
History section.
Recognizing the Type of Bottom
The bottom trace is the strongest echo shown in the
lower part of the left side of the screen.
A bottom trace with a wide chequered grey layer is
indicative of a hard bottom, because a hard bottom
returns strong echoes. Conversely, a soft bottom
produces medium or weak echoes, which are shown
by a narrower trace.
Small strong echo
(e.g. fish). This
usually flashes on and
off as the ultrasonic
pulse strikes the fish.
Large strong signal
(e.g. bottom)
Shading Bar
Recognizing the Type of Fish
Different species of fish have different sizes and
shapes of swim bladders. The air in the swim bladder
reflects the ultrasonic pulse, so the strength of the
echo varies between fish species according to the
size and shape of the swim bladder. The sonar
display on the FISH 4100 / 4150 is 70 pixels wide, so
it can show 70 levels of return echo strength, which
is a powerful feature.
When fishing among a school of fish and catching
them, note the fish species and the strength of the
echo that it returns on the fishfinder on the Sonar
Echo screen. Then, the next time that particular return
on the fishfinder is seen, it is likely to be the same
fish species.
3-5 SONAR screen


