


B-12
|
ni.com
Appendix B
Timing Diagrams
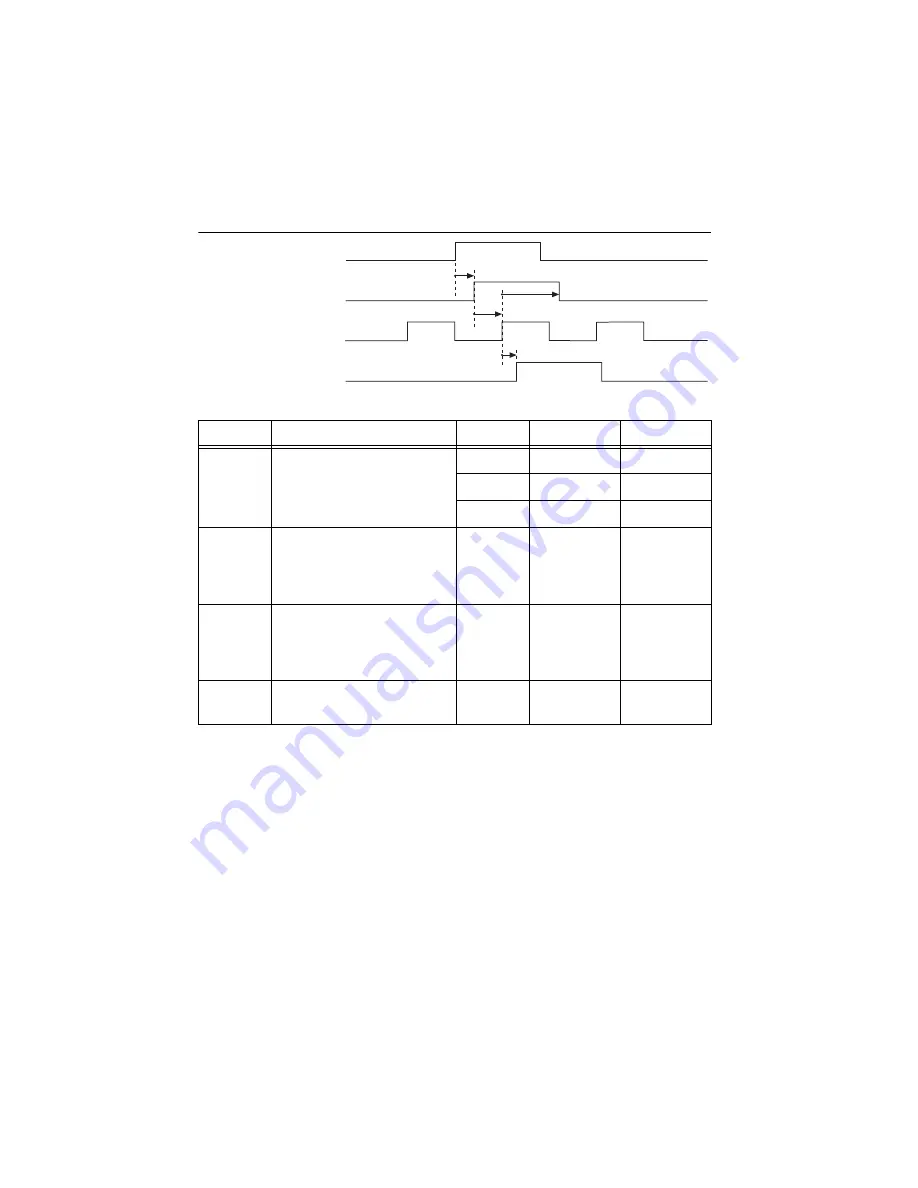
Figure B-12.
Sample Clock Timebase Timing Diagram
Table B-6.
Sample Clock Timebase Timing
Time
Description
Line
Min (ns)
Max (ns)
t
18
Delay to Selected Start Trigger
PFI
3.4
8.8
RTSI
3.3
8.5
STAR
2.7
5.7
t
19
Selected Start Trigger
Setup/Hold Time
(to Sync Sample Clock
Timebase)
—
1.5
—
t
20
Selected Start Trigger
Setup/Hold Time
(to Sync Sample Clock
Timebase)
—
0
—
t
21
Sync Sample Clock Timebase
to SI_Start
—
0.9
2.2
_i
Selected Start Trigger
Sync Sample Clock Timebase
SI Start
t
18
t
21
t
19
t
20
Artisan Technology Group - Quality Instrumentation ... Guaranteed | (888) 88-SOURCE | www.artisantg.com


