TN_IDA_1068_E_IQ_data
5 / 8
Subject to change
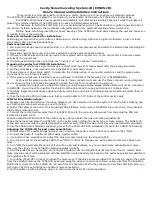
Figure 6: The signal spectrum (zoom display)
Figure 7: The IQ data of the signal shown graphically
versus time
Example 1: IQ data captured with IDA
In this example, the signal is a 16QAM signal; this is in fact not known at
the start of the measurement.
The signal can be seen in Spectrum mode (figure 6). The center
frequency and bandwidth must be entered to tune the IDA to the signal.
The center frequency, which is used to mix the signal down to the base
band, does not necessarily correspond exactly to the carrier frequency,
as this is not directly discernible from the signal itself. This has to be
corrected later by calculation.
AM or FM demodulation can be tried in order to find out more about the
signal type. If this does not give a clear indication, switch from Spectrum
to Scope mode using Extras > Go to. The IDA uses the same settings
made in Spectrum mode for this.
The Time Span and Channel Bandwidth (CBW) settings need to be
made, depending on whether you want to view or store the signal. The
CBW has to be set such that the Nyquist-Shannon sampling theorem is
at least fulfilled if the signal is to be displayed and further processed.
This means that the CBW must be at least twice the signal bandwidth.
Since the selection filter of the IDA limits the signal bandwidth, it is a
good idea to select a more generous CBW than this, otherwise the
edges of the selection filter in the IDA (used to capture the data) and
those of the actual receive filter (in the emulated receiver) will overlap in
the subsequent emulation of the actual receiver.
The IDA can display the IQ data directly as a graph versus time
(figure 7). They can be transferred to an SD card, read out using the
IDA-Tools software and exported, or accessed directly via one of the
available remote interfaces for further processing using a PC.